Patterns of Data, Helsinki, 16-27 May 2011.
Each SMS we receive, each Facebook event we attend and every web search we do is captured for eternity. It's as if our existence can be reduced to an endless stream of numbers. What if we could visualize this data and discover patterns in the chaos?
During this workshop, we'll use a new tool well suited for visualizing data. Through a visual, node-based approach, we'll create interesting and unique visualizations that evolve and react on varying input. We'll learn how to capture, prepare, visualize and refine data. The end result will be a poster with a visualization around a self-chosen theme. Enterprising students can even create data animations ("datamations").
This workshop is for designers new to NodeBox and data visualization. We will learn to look at data differently, and gain insight in how to create new and interesting designs.
Data is taking over your life. It's time to take control.
This workshop takes place in the Aalto University in Helsinki, Finland from 16 to 27 May.

NodeBox 2.0.980 with PNG export

Waiting for movie-export......
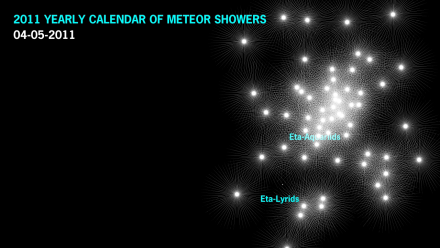
Meteor shower animation - so far

Using Nodebox to create a book cover.

Progress on 'Friday' Dashboard Animation

'Three Minutes and Thirty-Eight Seconds' Final Poster

This is an animation I wa..ALL GLORY TO THE HYPNOTOAD!
Test animation
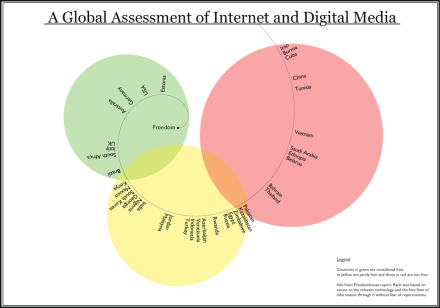
Internet Freedom poster /Artr
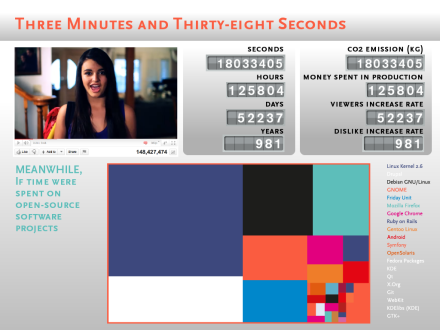
Friday Dashboard Animation
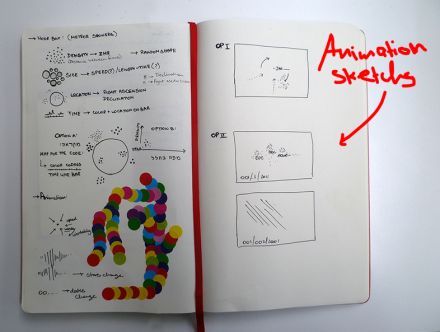
First sketches - meteor shower forecast - animation

Final Poster - 2011 yearly calendar of meteor showers

Poster / Cvijeta

Sun in the cities

Night version of sunflowers

'Three Minutes and Thirty-Eight Seconds' Poster progress...

Three layout options for the meteor calendar
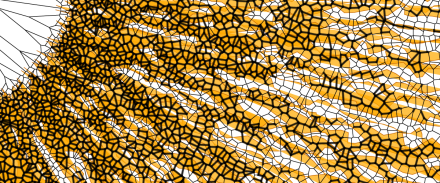
Sunflowers
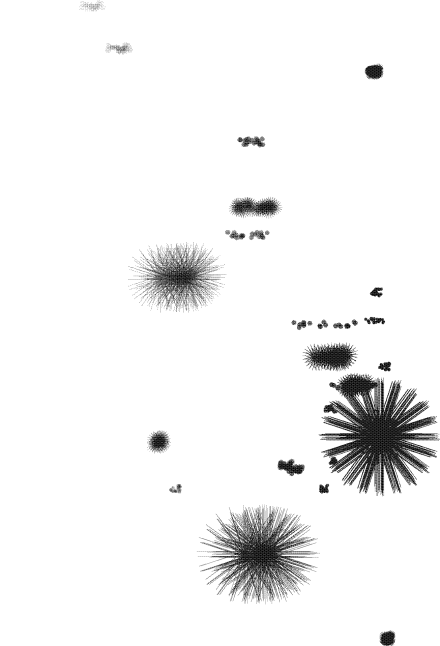
Some stars are starting to emerge....
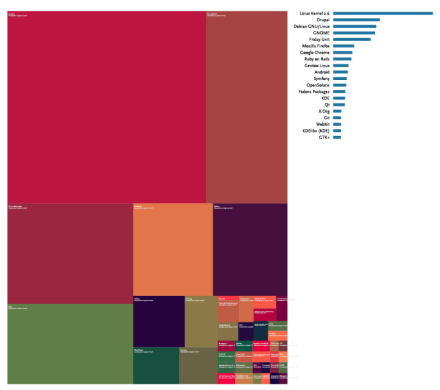
Progress so far with 'Friday' project

First attempt with playing around with the data/Tirza
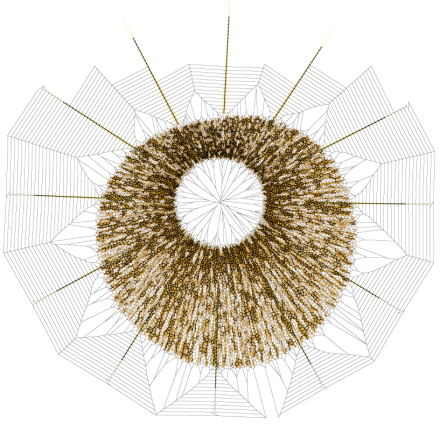
Assignment - second thoughts
Suggestion for next assignment / Tirza
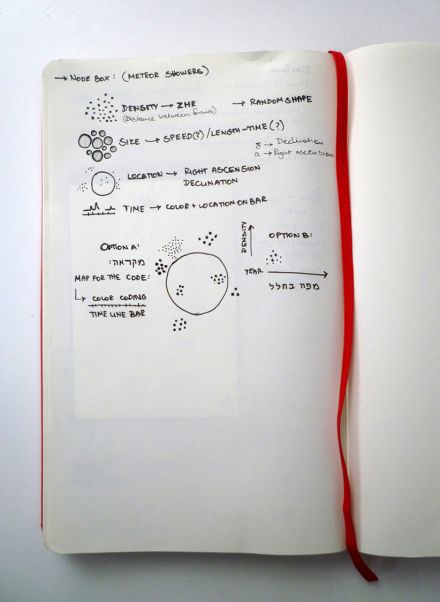
Some sketches and starting to sort out the data / Tirza
Next assignment /Artr
First Ideas
Delicious > Infographics
Kalle's data visualisation idea

tirza's drafted monsters
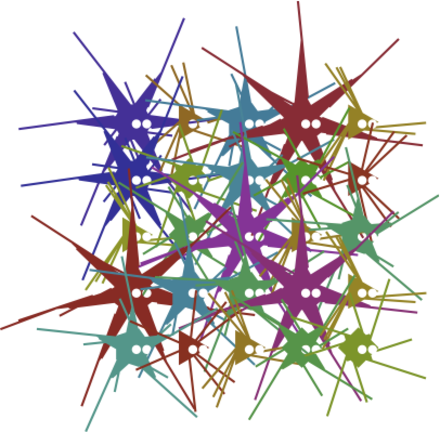
Lucía´s monster
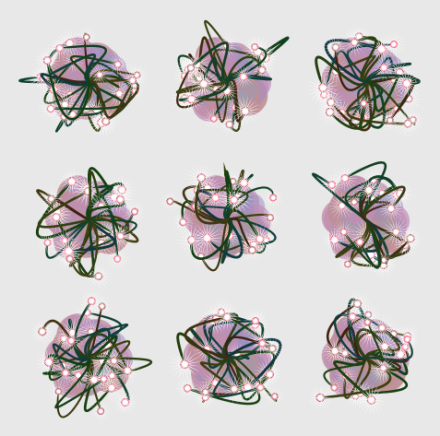
Kalle's monster

Cvijeta's monster

Cheesy Letters / Sarun

Artr's monstr

Approach for the next assignment / Sarun

Aggressive financials /mikko
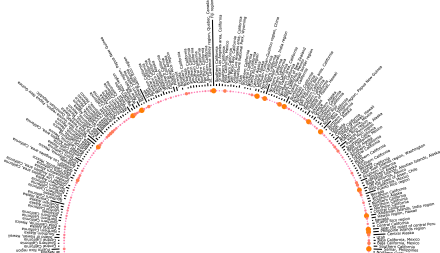
csv files