Data Visualization Workshop in Antwerp, 13 - 17 February 2012.
This website is a liveblog of a NodeBox workshop on Data Visualization taking place in Antwerp, Belgium, 13 - 17 February 2012. We'll learn how to capture, prepare, visualize and refine data. The end result will be a poster with a visualization around a self-chosen theme.
This workshop is for designers new to NodeBox and data visualization. We will learn to look at data differently, and gain insight in how to create new and interesting designs.
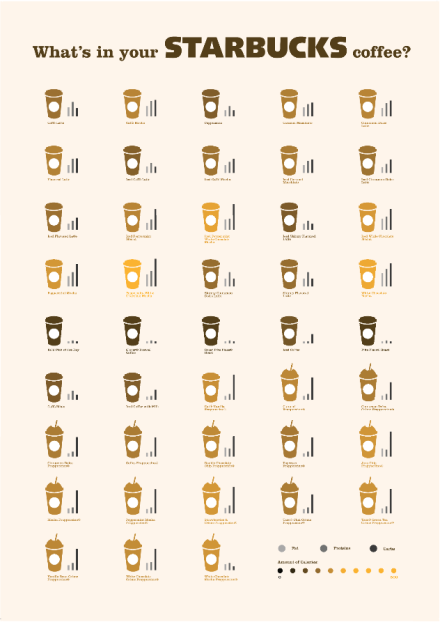
what's in your STARBUCKS coffee? (3)
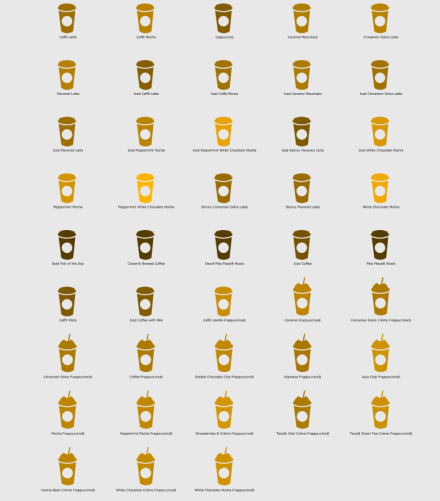
What's in your STARBUCKS coffee? (2)
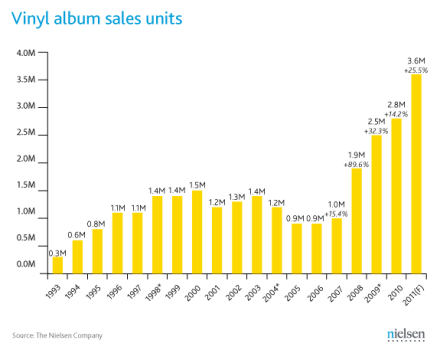
Piracy & Vinyl Revival
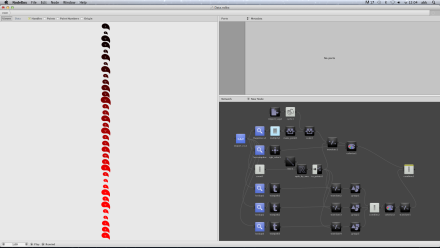
The Happiness Factory Final
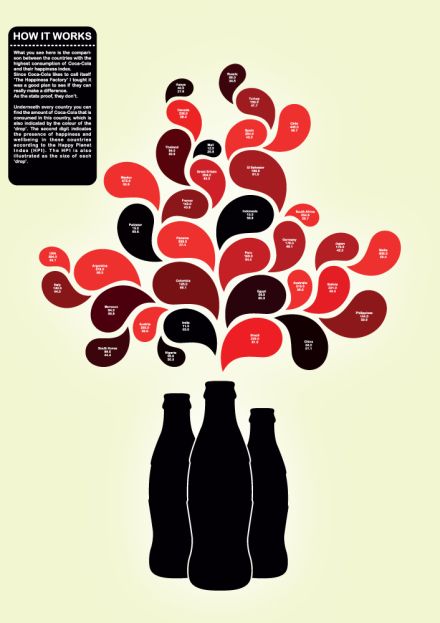
The Happiness Factory Final Poster
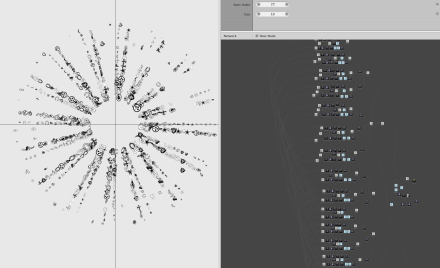
Super Bowl XLVI
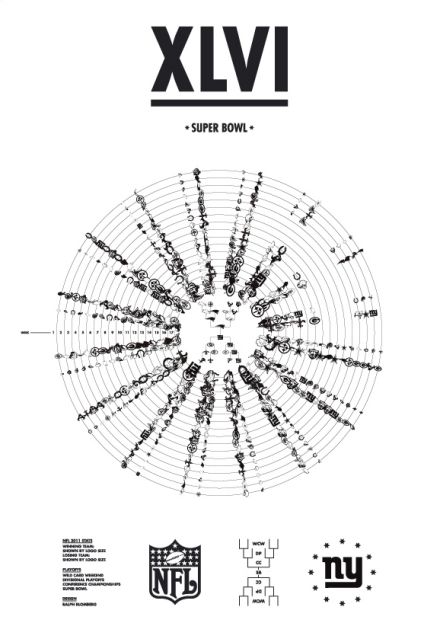
super Bowl XLVI (3)
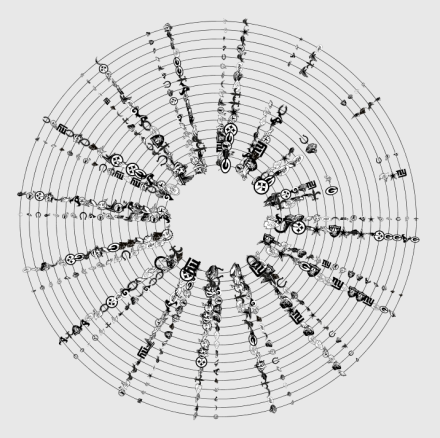
Super Bowl XLVI (2)
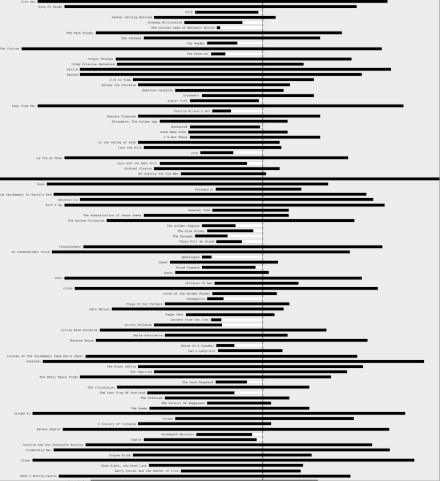
Pirating The Oscars 2003-2012 (2)
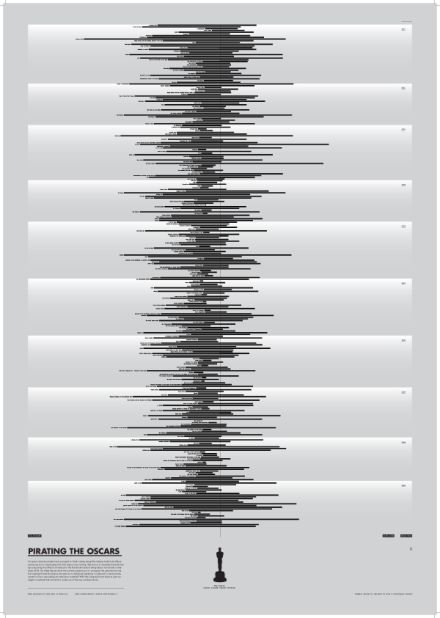
Pirating The Oscars (final poster)
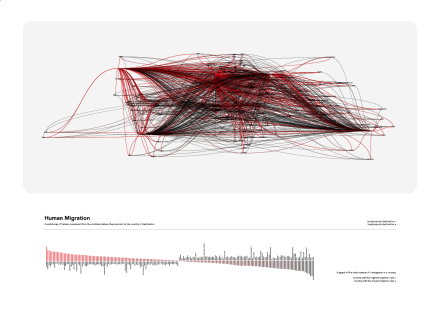
Human Migration Final Poster
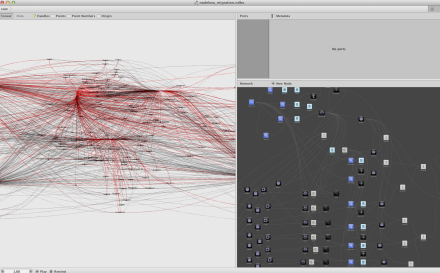
Human Migration (3)
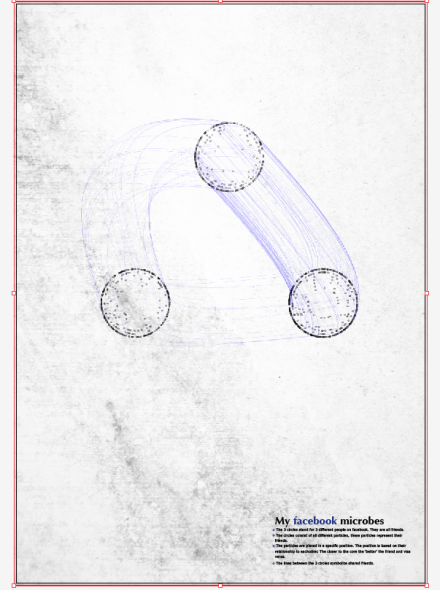
Facebook microbes
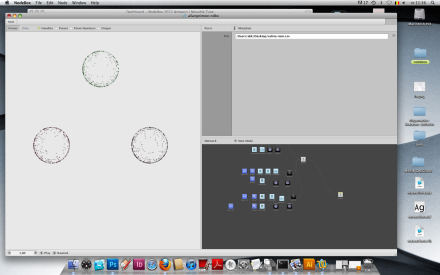
Facebook data

Alumni samenvatting
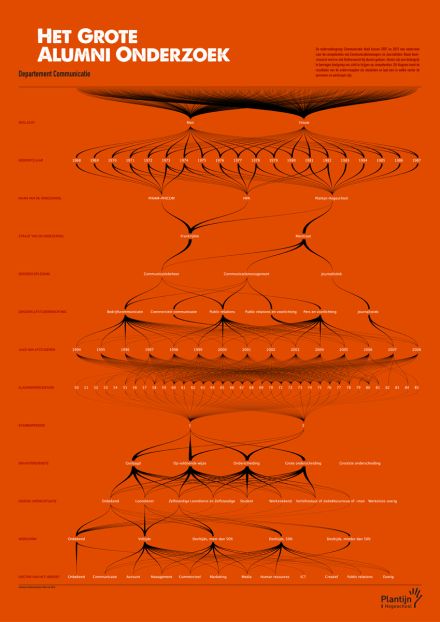
Alumni Plantijn - Final poster
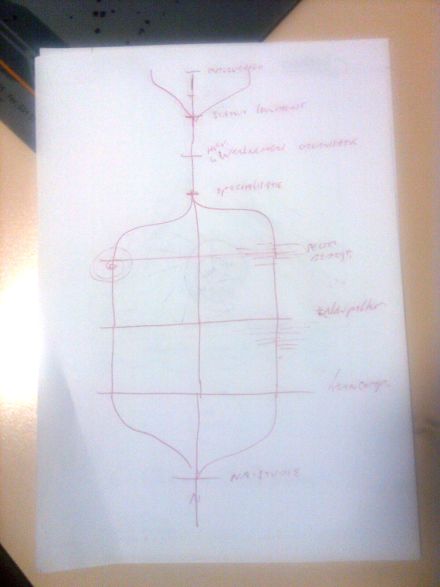
Overzicht alumni Plantijn Hogeschool
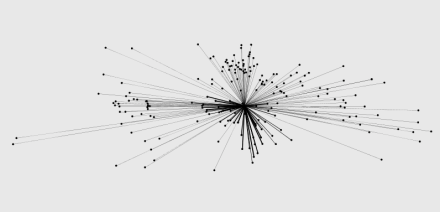
Human Migration (2)
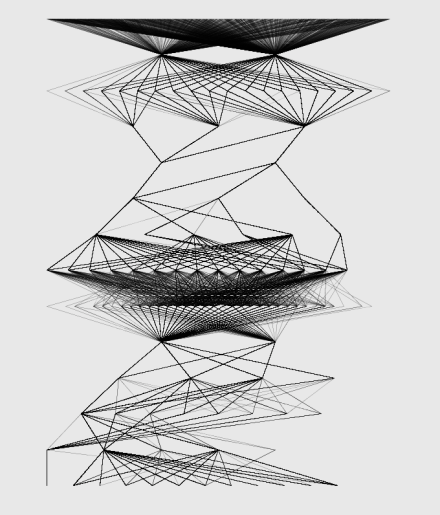
Alumni stap 2
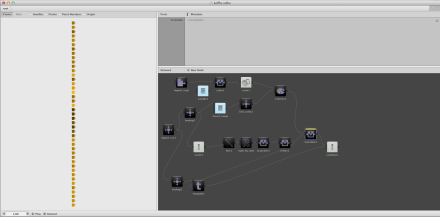
What's in your Starbucks coffee?
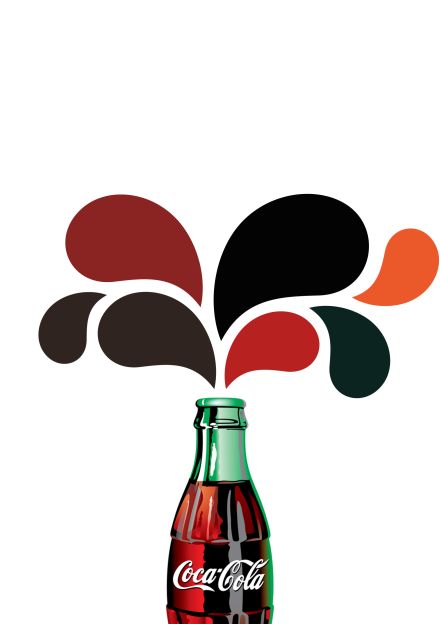
The Happiness Factory Day 2
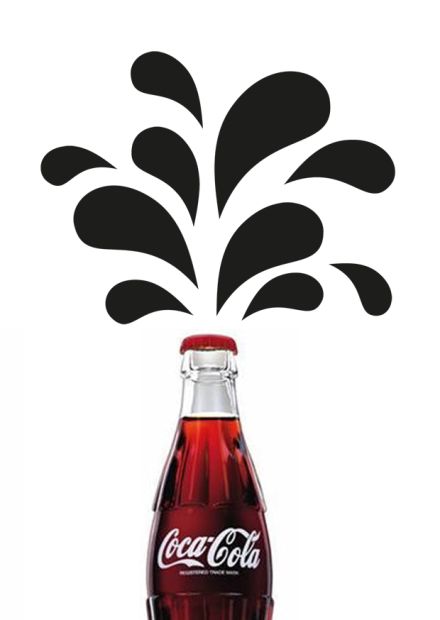
The Happiness Factory Day 1
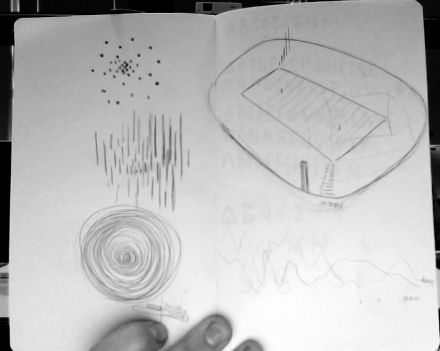
American Football
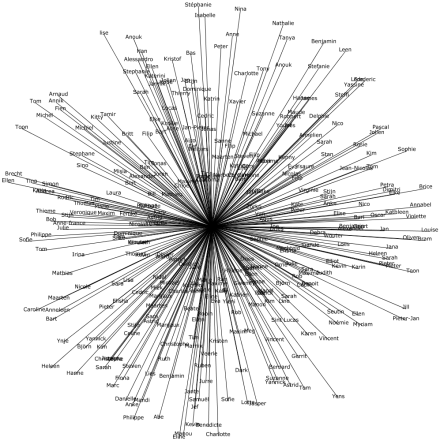
Facebook info
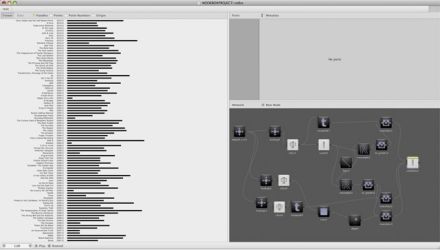
Pirating the Oscars 2003-2012
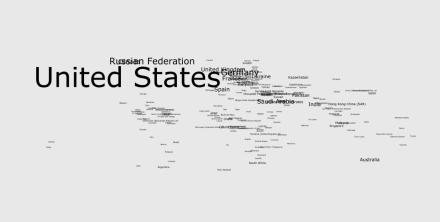
Human Migration
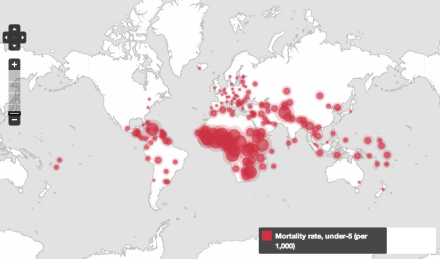
Source of Data and Inspiration
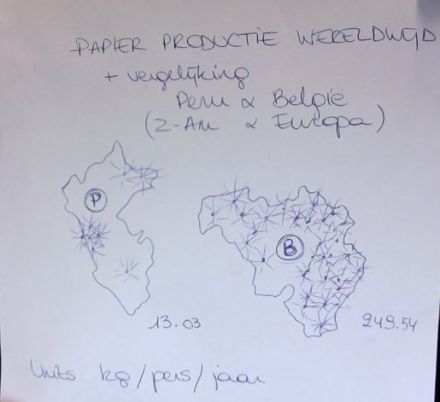
Paper productie & consumptie
<No Title>