Dataviz: Visual Repesentation of Complex Phenomena, 12-17 December 2011, Torino.
An in-depth workshop on the visual representation of large datasets. Study how to capture, prepare, visualize and refine data. Gain insight in dataviz theories and start to look at data in a different way. Learn about the history of data visualization and how to create your own new and interesting designs for the future.
We use NodeBox 2 to visualize the data.
The workshop is run by the Experimental Media Research Group and Density Design. Organization by Better Nouveau.

#OWS Rollecoaster

#OWS Rollecoaster

#OWS Rollecoaster

#OWS Rollecoaster

The periodic table of italian local authorities

D3 final work
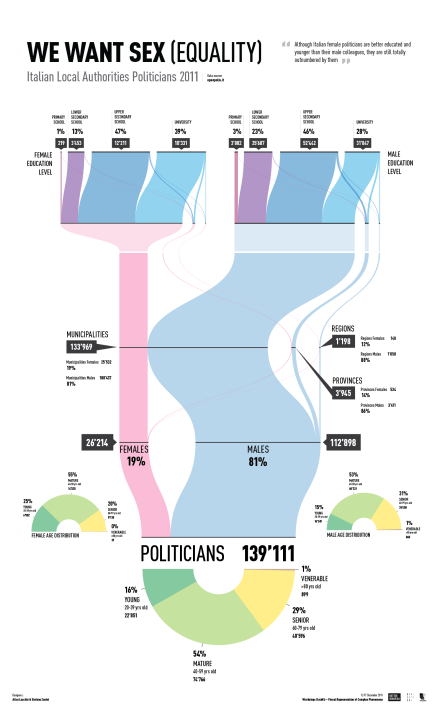
Politicians Sankey - Final Poster
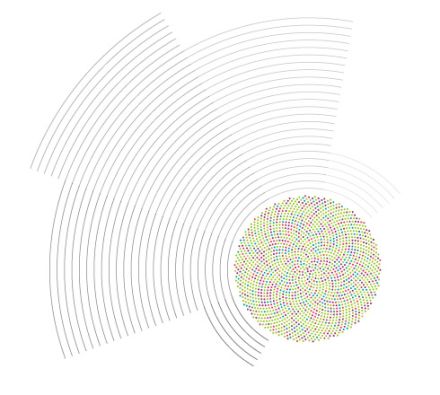
More phyllotaxis
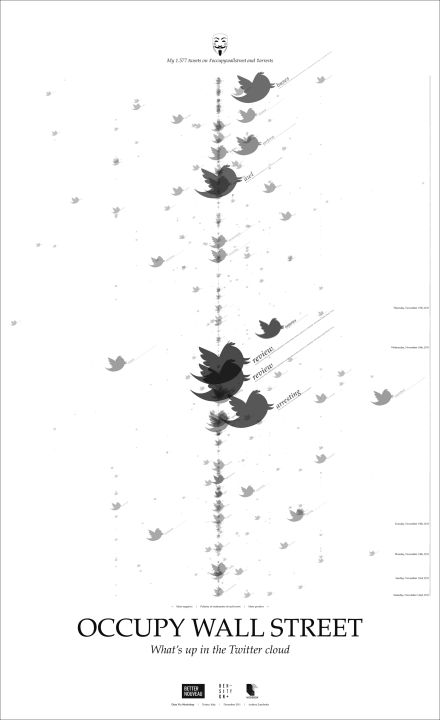
Occupy Wall Street, Arrested People - Final Poster
Course Material
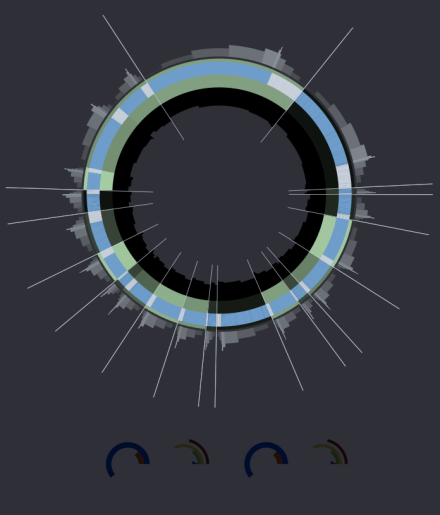
SO FAR

postal code 2
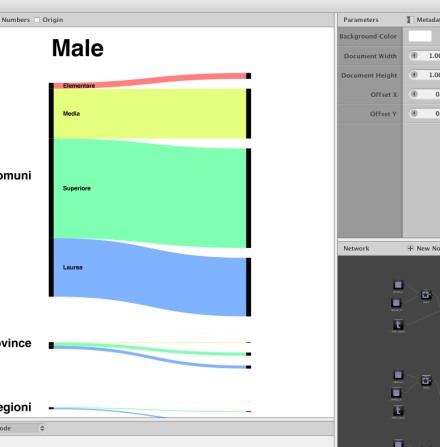
Politicians Sankey - Day 3: NodeBoxing

Phyllotaxis

Just another data visualisation on Occupy Wall Street Movement based on Twitter dataset

First Concept

Politician's distribution

UK Postal Codes
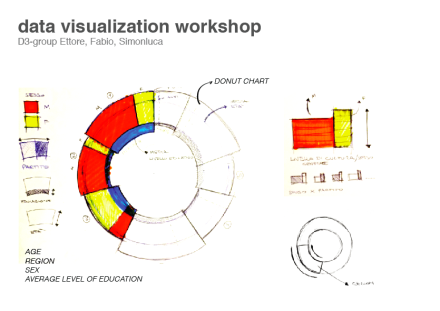
Rainbow Donut

Politicians Sankey - Day 2: WIP
