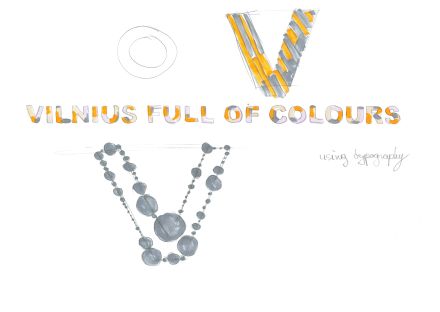
Data Visualization Workshop in Vilnius, 14-18 April 2014.
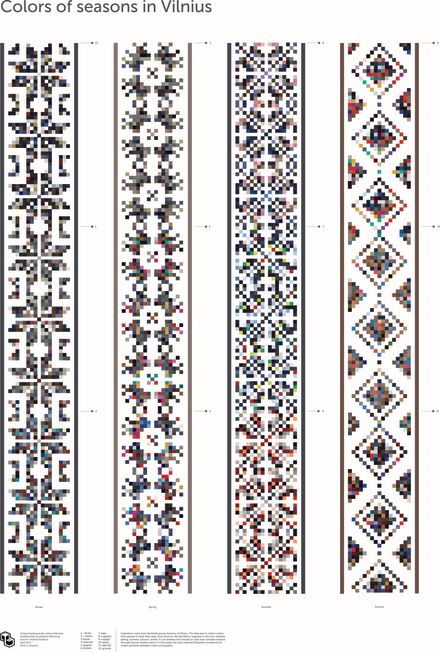
Final result: Colors of Vilnius
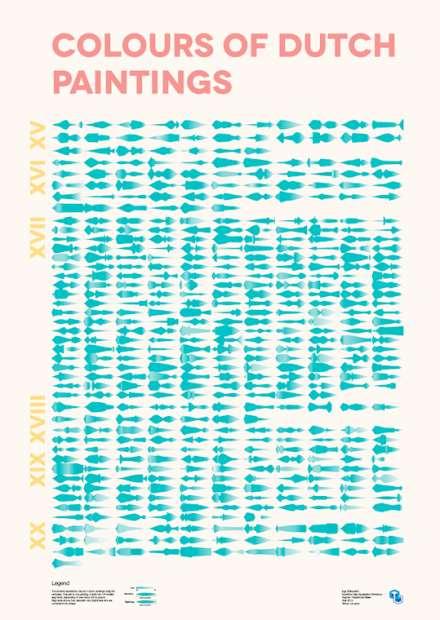
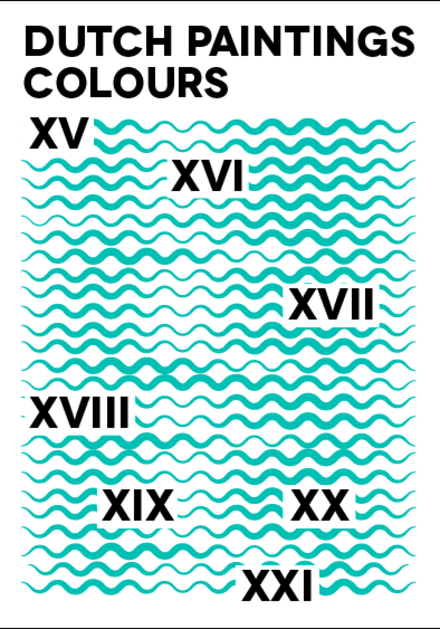
Final result: Colours of dutch paintings

Perpetual Sun and Moon calendar
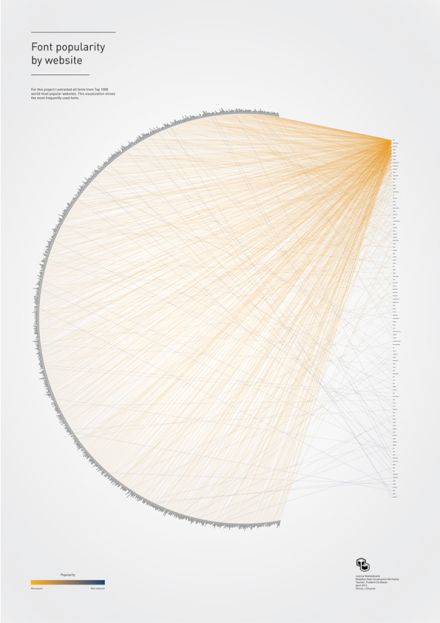
Final poster
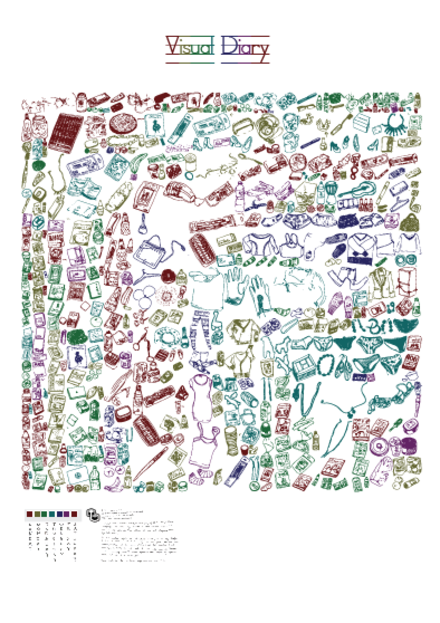
Final Poster Visual Diary
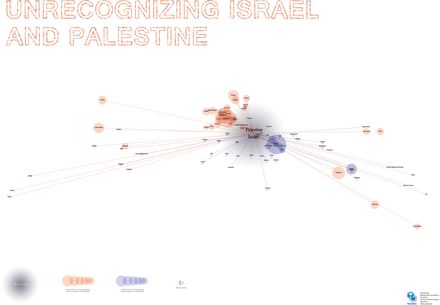
Final poster. Unrecognising Israel and Palestine
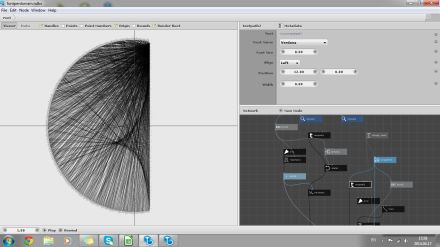
working with data in nodebox
Visualization
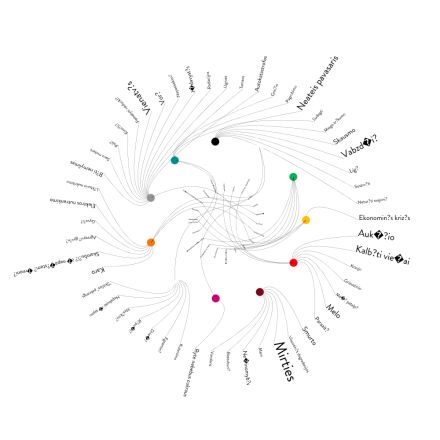
Visualisation of data 2
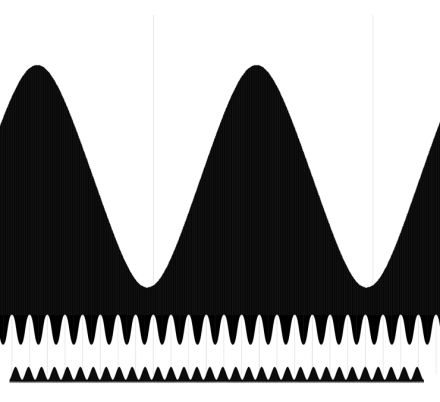
Ups and downs
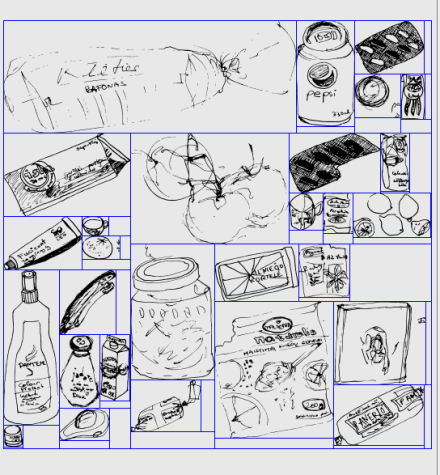
Think inside the box
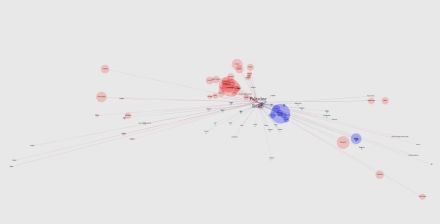
Sketch 4. Unrecognising Israel and Palestine
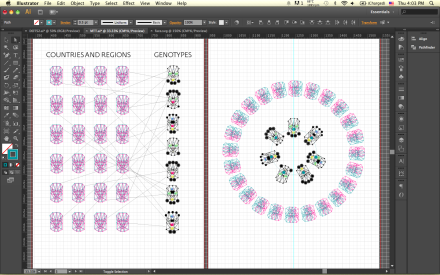
MTT Countries and Regions

Colors of Vilnius

Working on sun and moon calendar
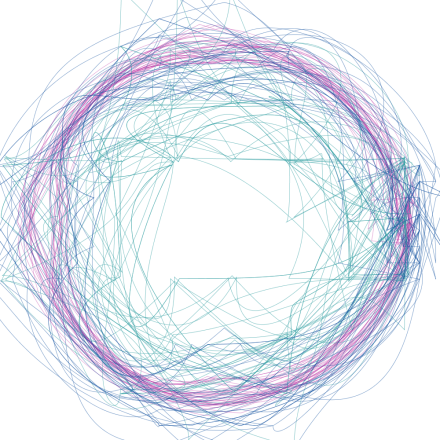
Visualisation of data
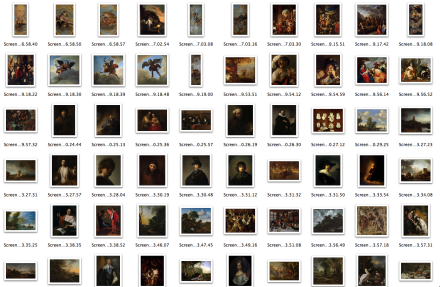
Step three: pictures turns into colours
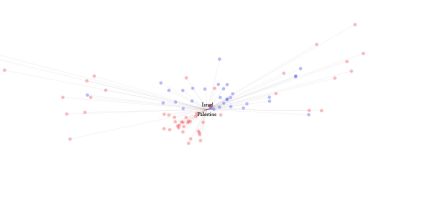
Sketch 3. unrecognized Israel and Palestine

Progress
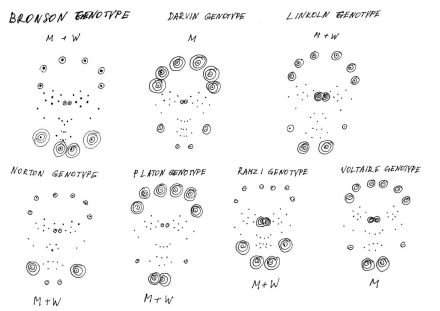
MTT Genotypes
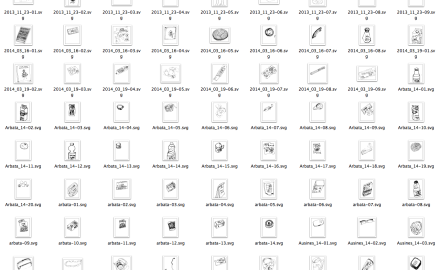
In progress
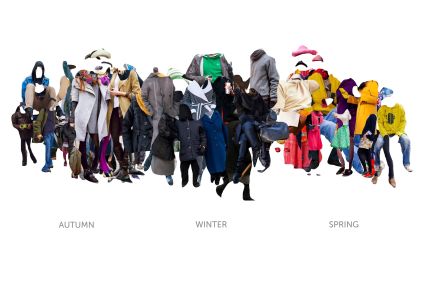
Colors of Vilnius

Visual diary

Vectorizing state
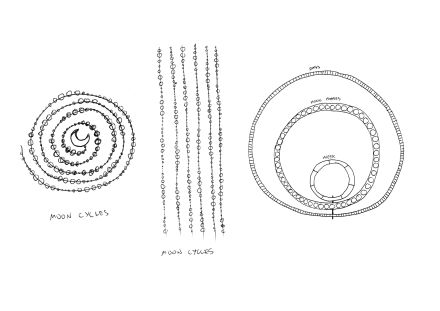
sun and moon cycles or kids cancer?
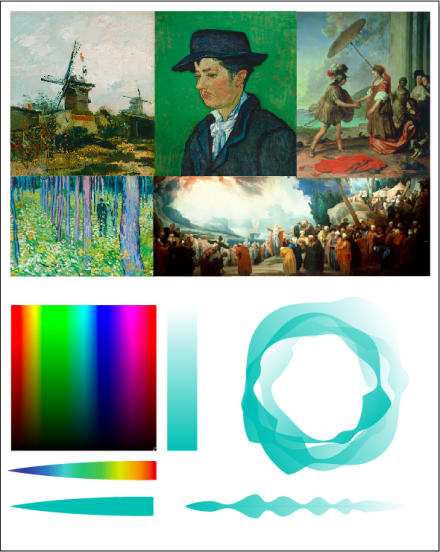
Step two: picking paintings
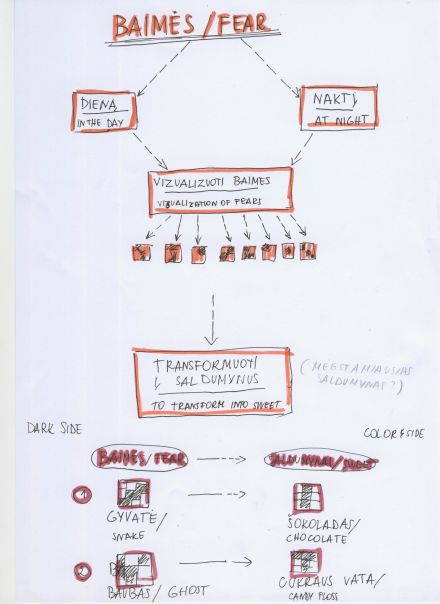
Sketches: Fears
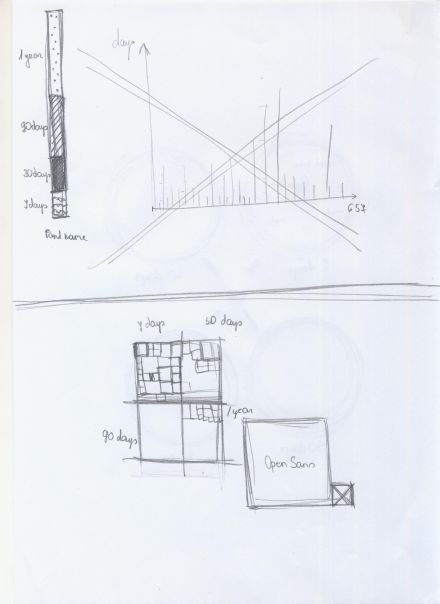
Sketch 2
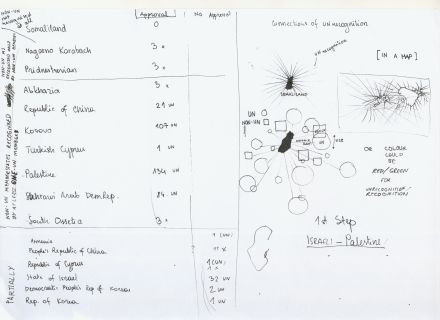
Sketch 2. Connections of UNrecognition
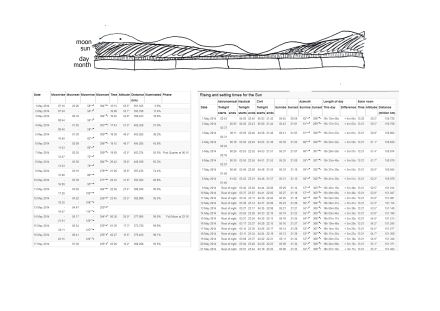
Searching for data for sun and moon calendar
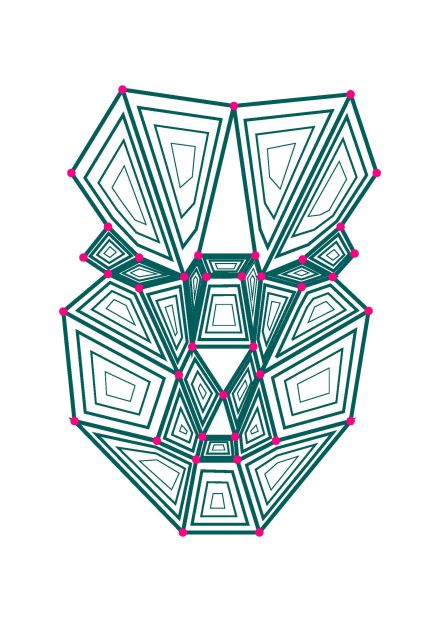
ID Masks
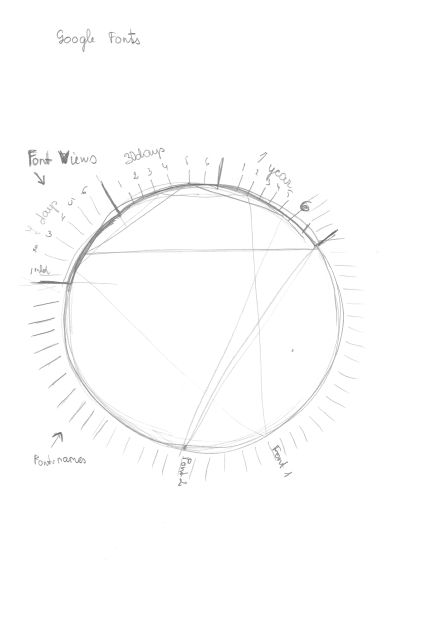
Google Fonts
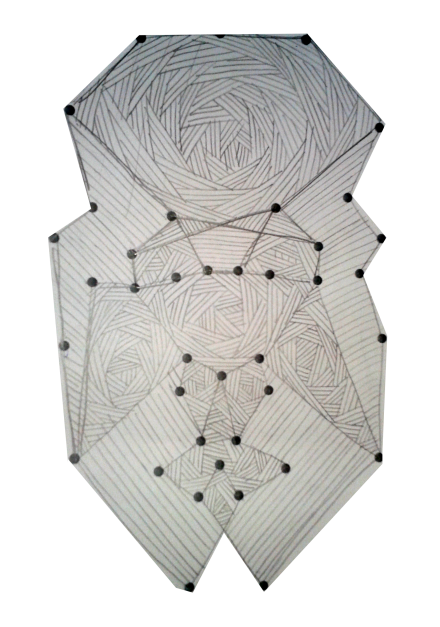
Face Mask by Genotype
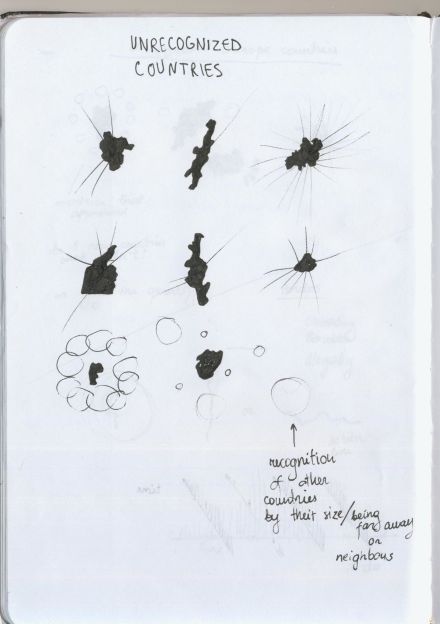
Day 1, sketch
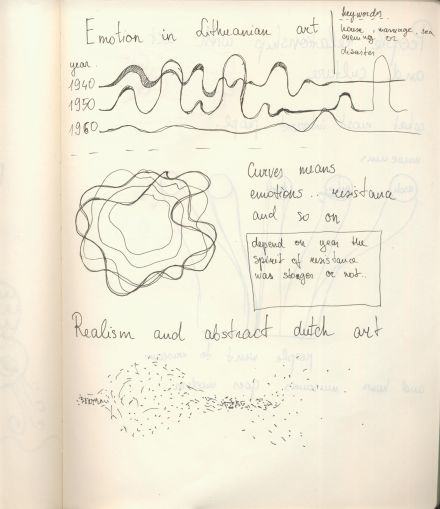
Colors in paintings