Data Visualization Workshop in Montréal, 28/4-4/5 2013.
During this workshop, we'll use a new tool well suited for visualizing data. Through a visual, node-based approach, we'll create interesting and unique visualizations that evolve and react on varying input. We'll learn how to capture, prepare, visualize and refine data.
This workshop is for designers new to NodeBox and data visualization. We will learn to look at data differently, and gain insight in how to create new and interesting designs.
This workshop takes place during the Design International 2013 week in the École de design in Montréal, Canada.
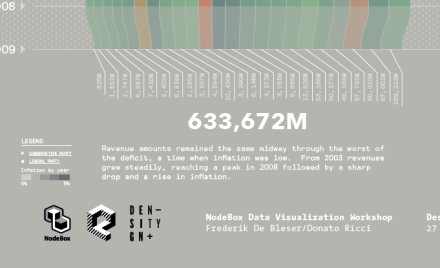
Final day
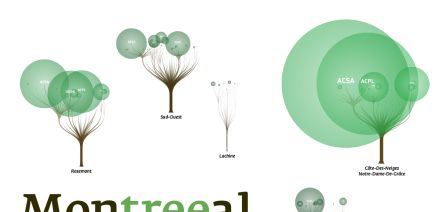
The Final Poster

The Last En-tree

Day n°5: Jesse, Benjamin, Louis
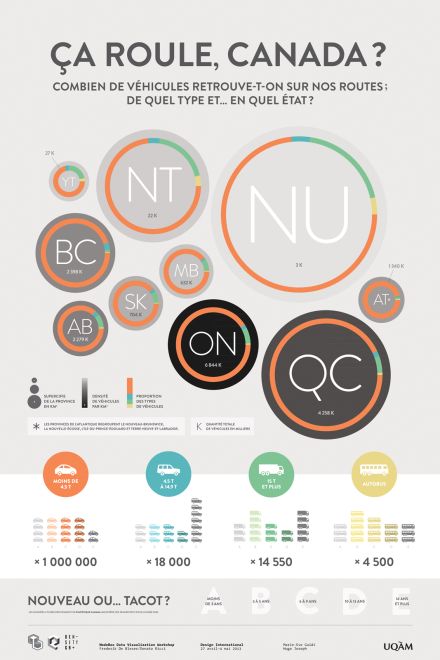
Day 5 ! Final Stuff
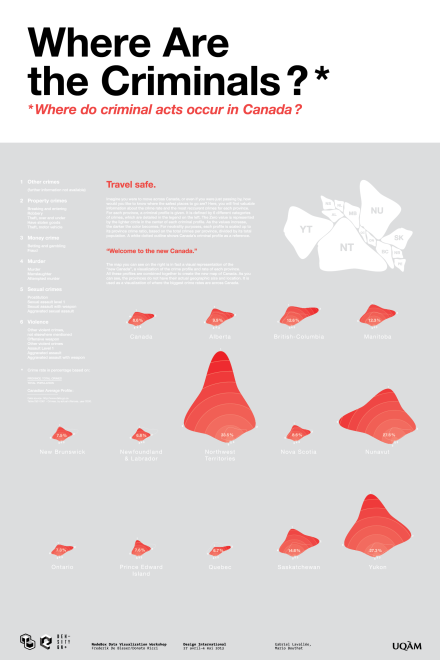
Where are the criminals? - Step 4
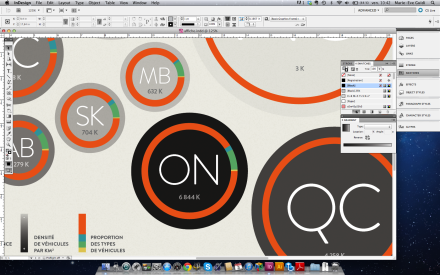
THERE is the teaser...
Last day - Hurry!
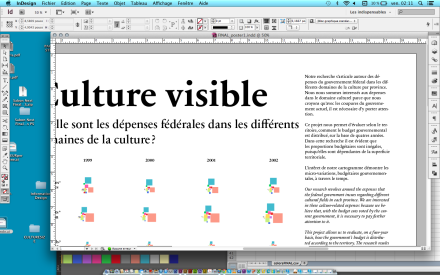
Final sprint

Day 5
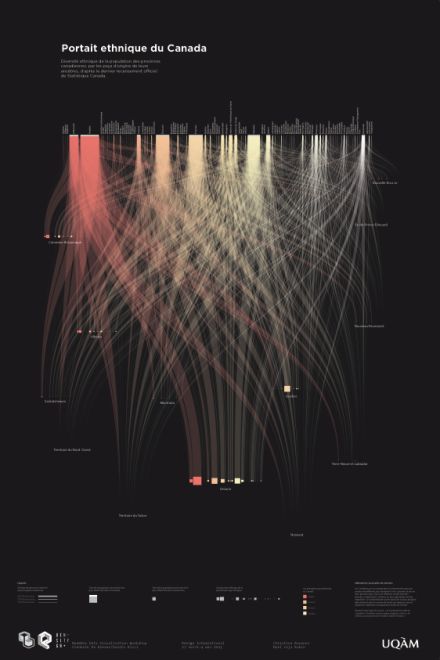
Day 5 - FINAL VISUAL
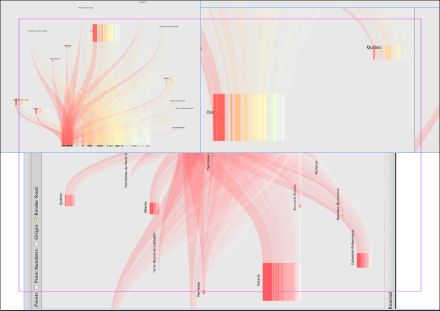
Day 4 - LATE NIGHT!
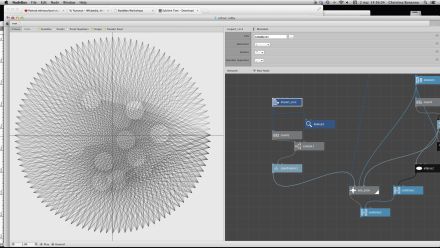
Day 4 - Evening and NOTHING WORKS!
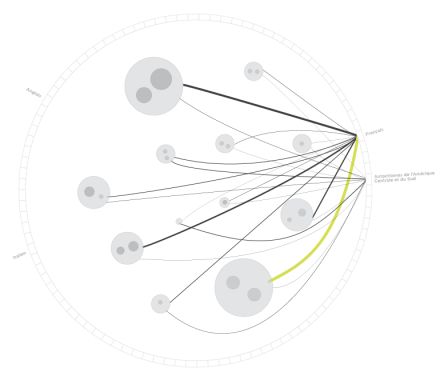
Day 4 - Busy production morning
Work in Progress
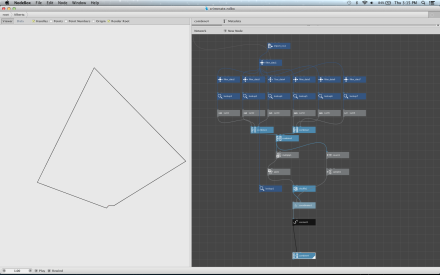
Where are the criminals? - Step 3
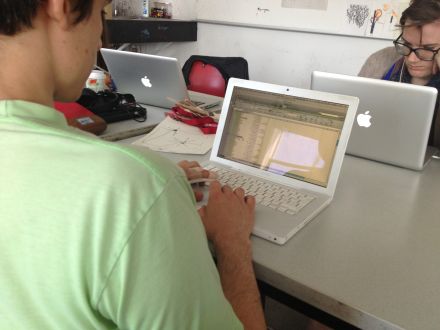
The root is on fire !!!
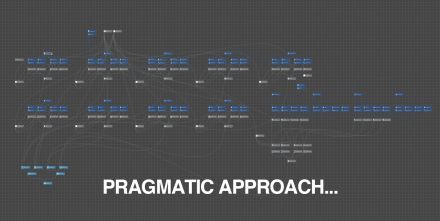
Pictures (should be with the last post...anyway)
Files links
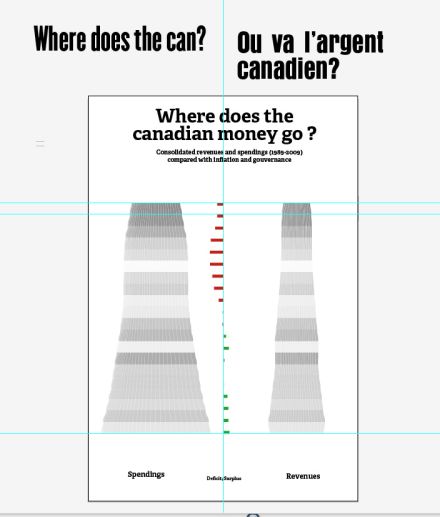
Days 4 - Boris, Guillaume, Hugo

Day Tree
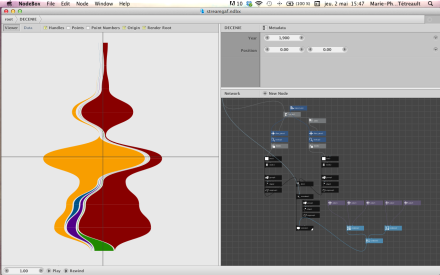
Day n°4: Benjamin, Jesse, Louis

Day nr 3 David, Simon, Samuel
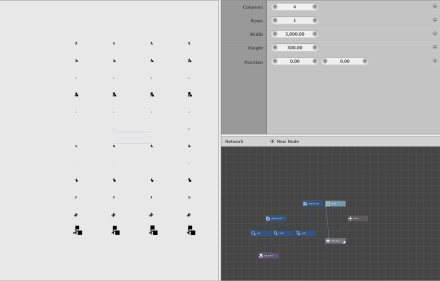
Day FOUR
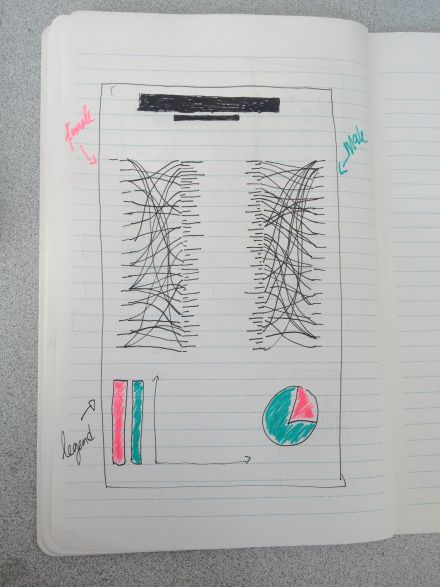
Day 4 (Melissa & Krystina)
Day 3
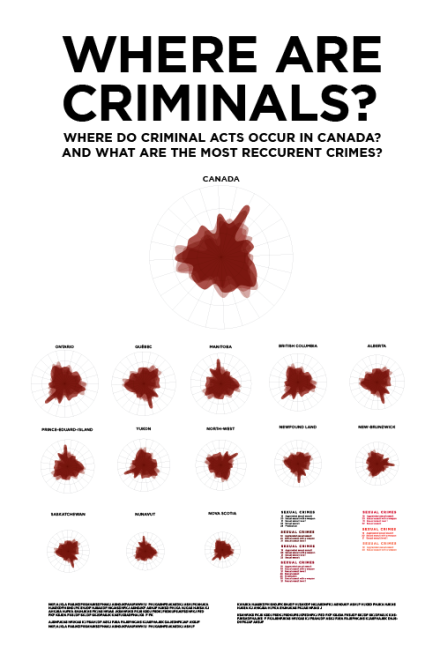
Where are the criminals? - Step 2
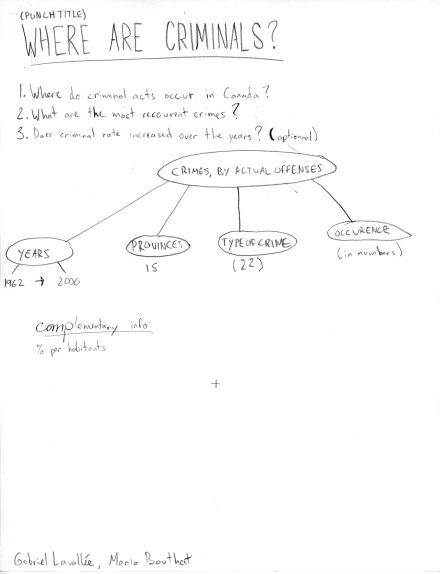
Where are the criminals? - Step 1
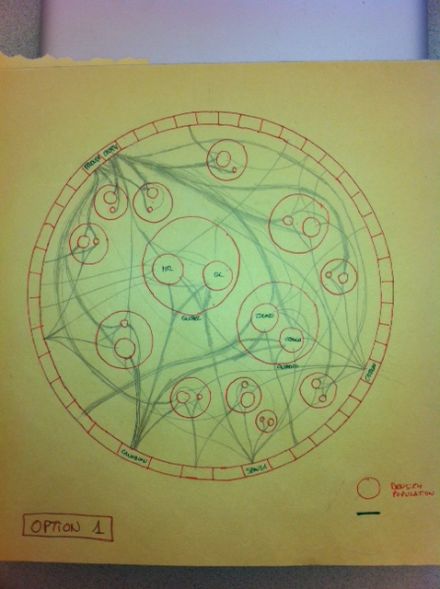
Day 3 - Chris & Niel
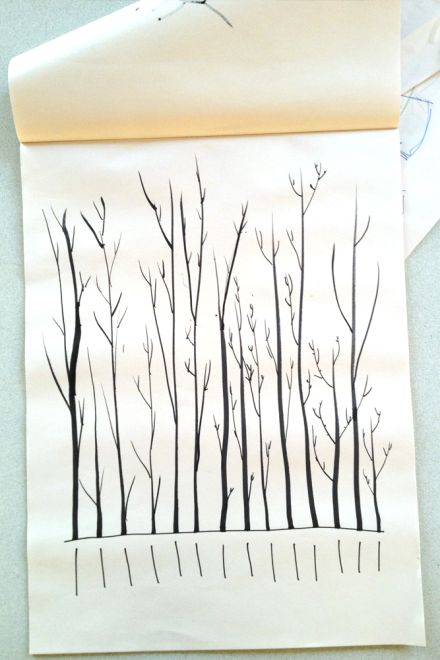
Once Upon a Tree...
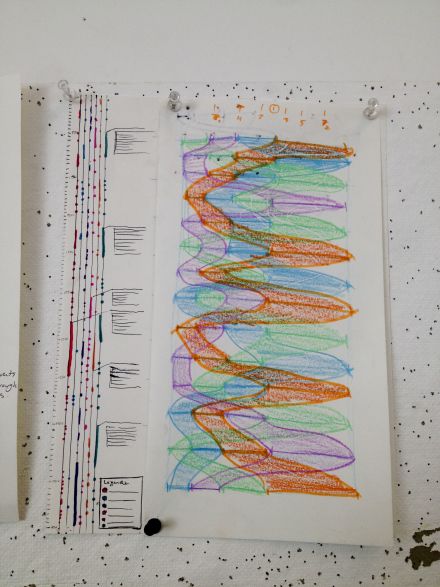
Day n°3: Benjamin, Jesse, Louis

Day nr 2 David, Simon, Samuel
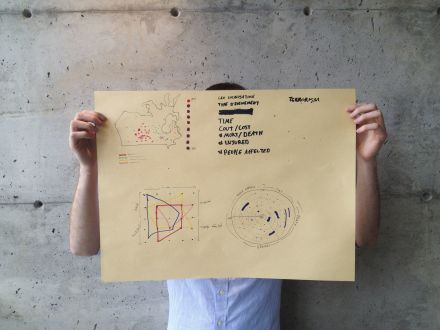
Day n°2: Benjamin, Jesse, Louis
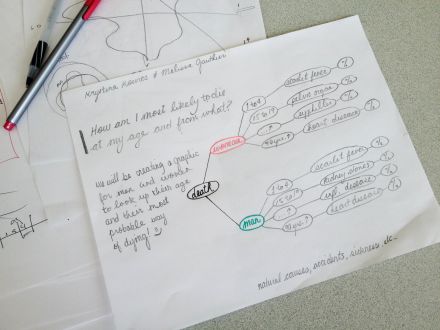
Day 3 (Pre-production day)

Day 3... Nice! It takes form!
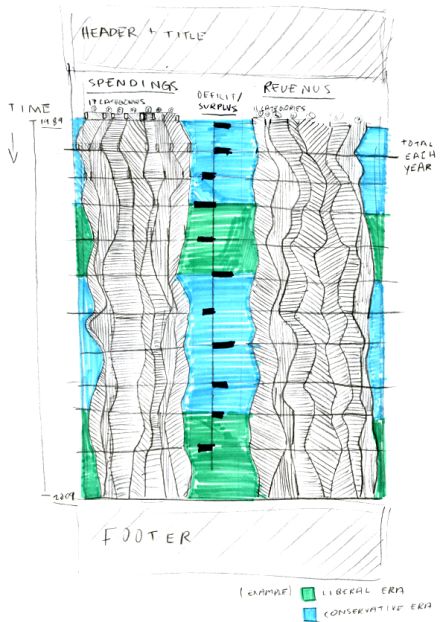
Day 3 - Guillaume Hugo Boris
Day 3 Data

Day 3 (Cyrus, Emanuel ans Emilie)
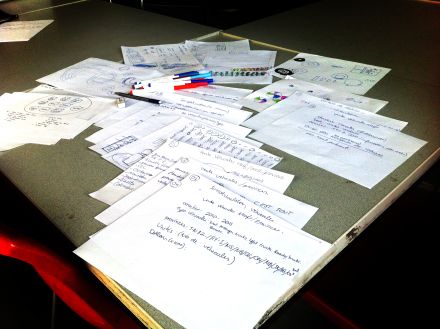
Day 2... - Marie-Ève Guidi & Hugo Joseph

Day 2 (Krystina and Melissa)
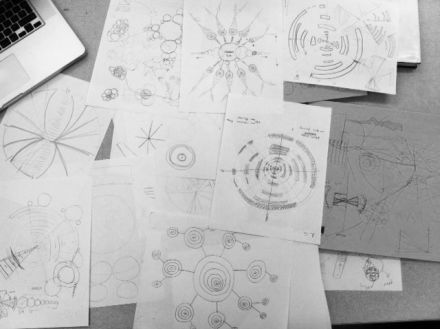
Chris & Niel - Step 1
Guillaume Hugo Boris-Step 1
