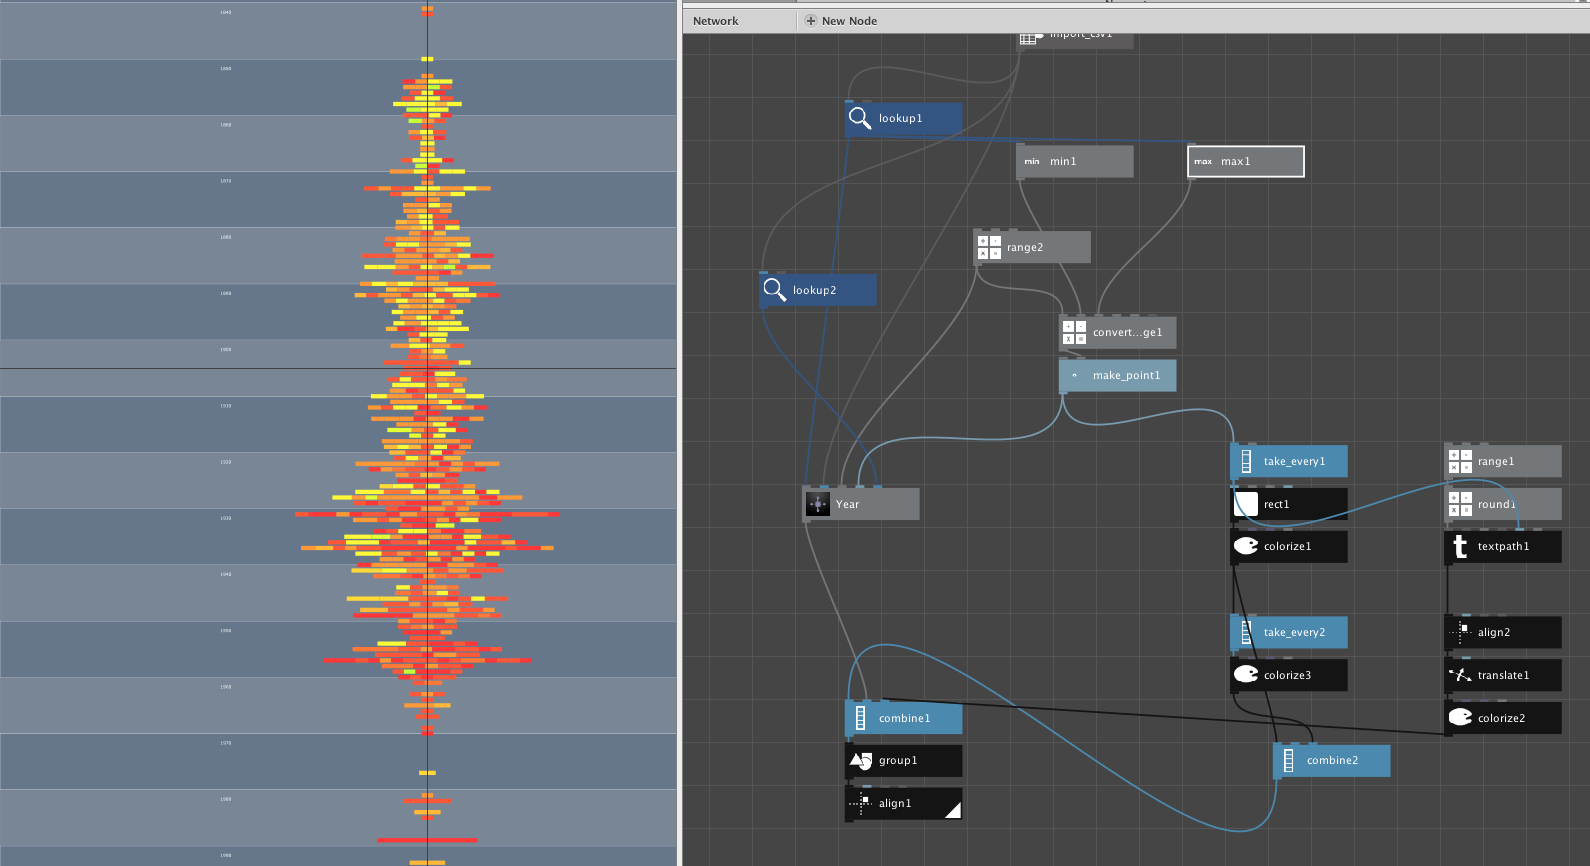
The basic visualisation of the amount and size of sunken ships per year now works in nodebox also on a timeline indicating the decades.
I am now looking at adding a second dataset, like population growth or wind information per year to implement as a connection.
The different colours of the Ships are representing their cause of sinking, e.g. grounding or exploding. Those colors will get customized later in Illustrator.