Hello,
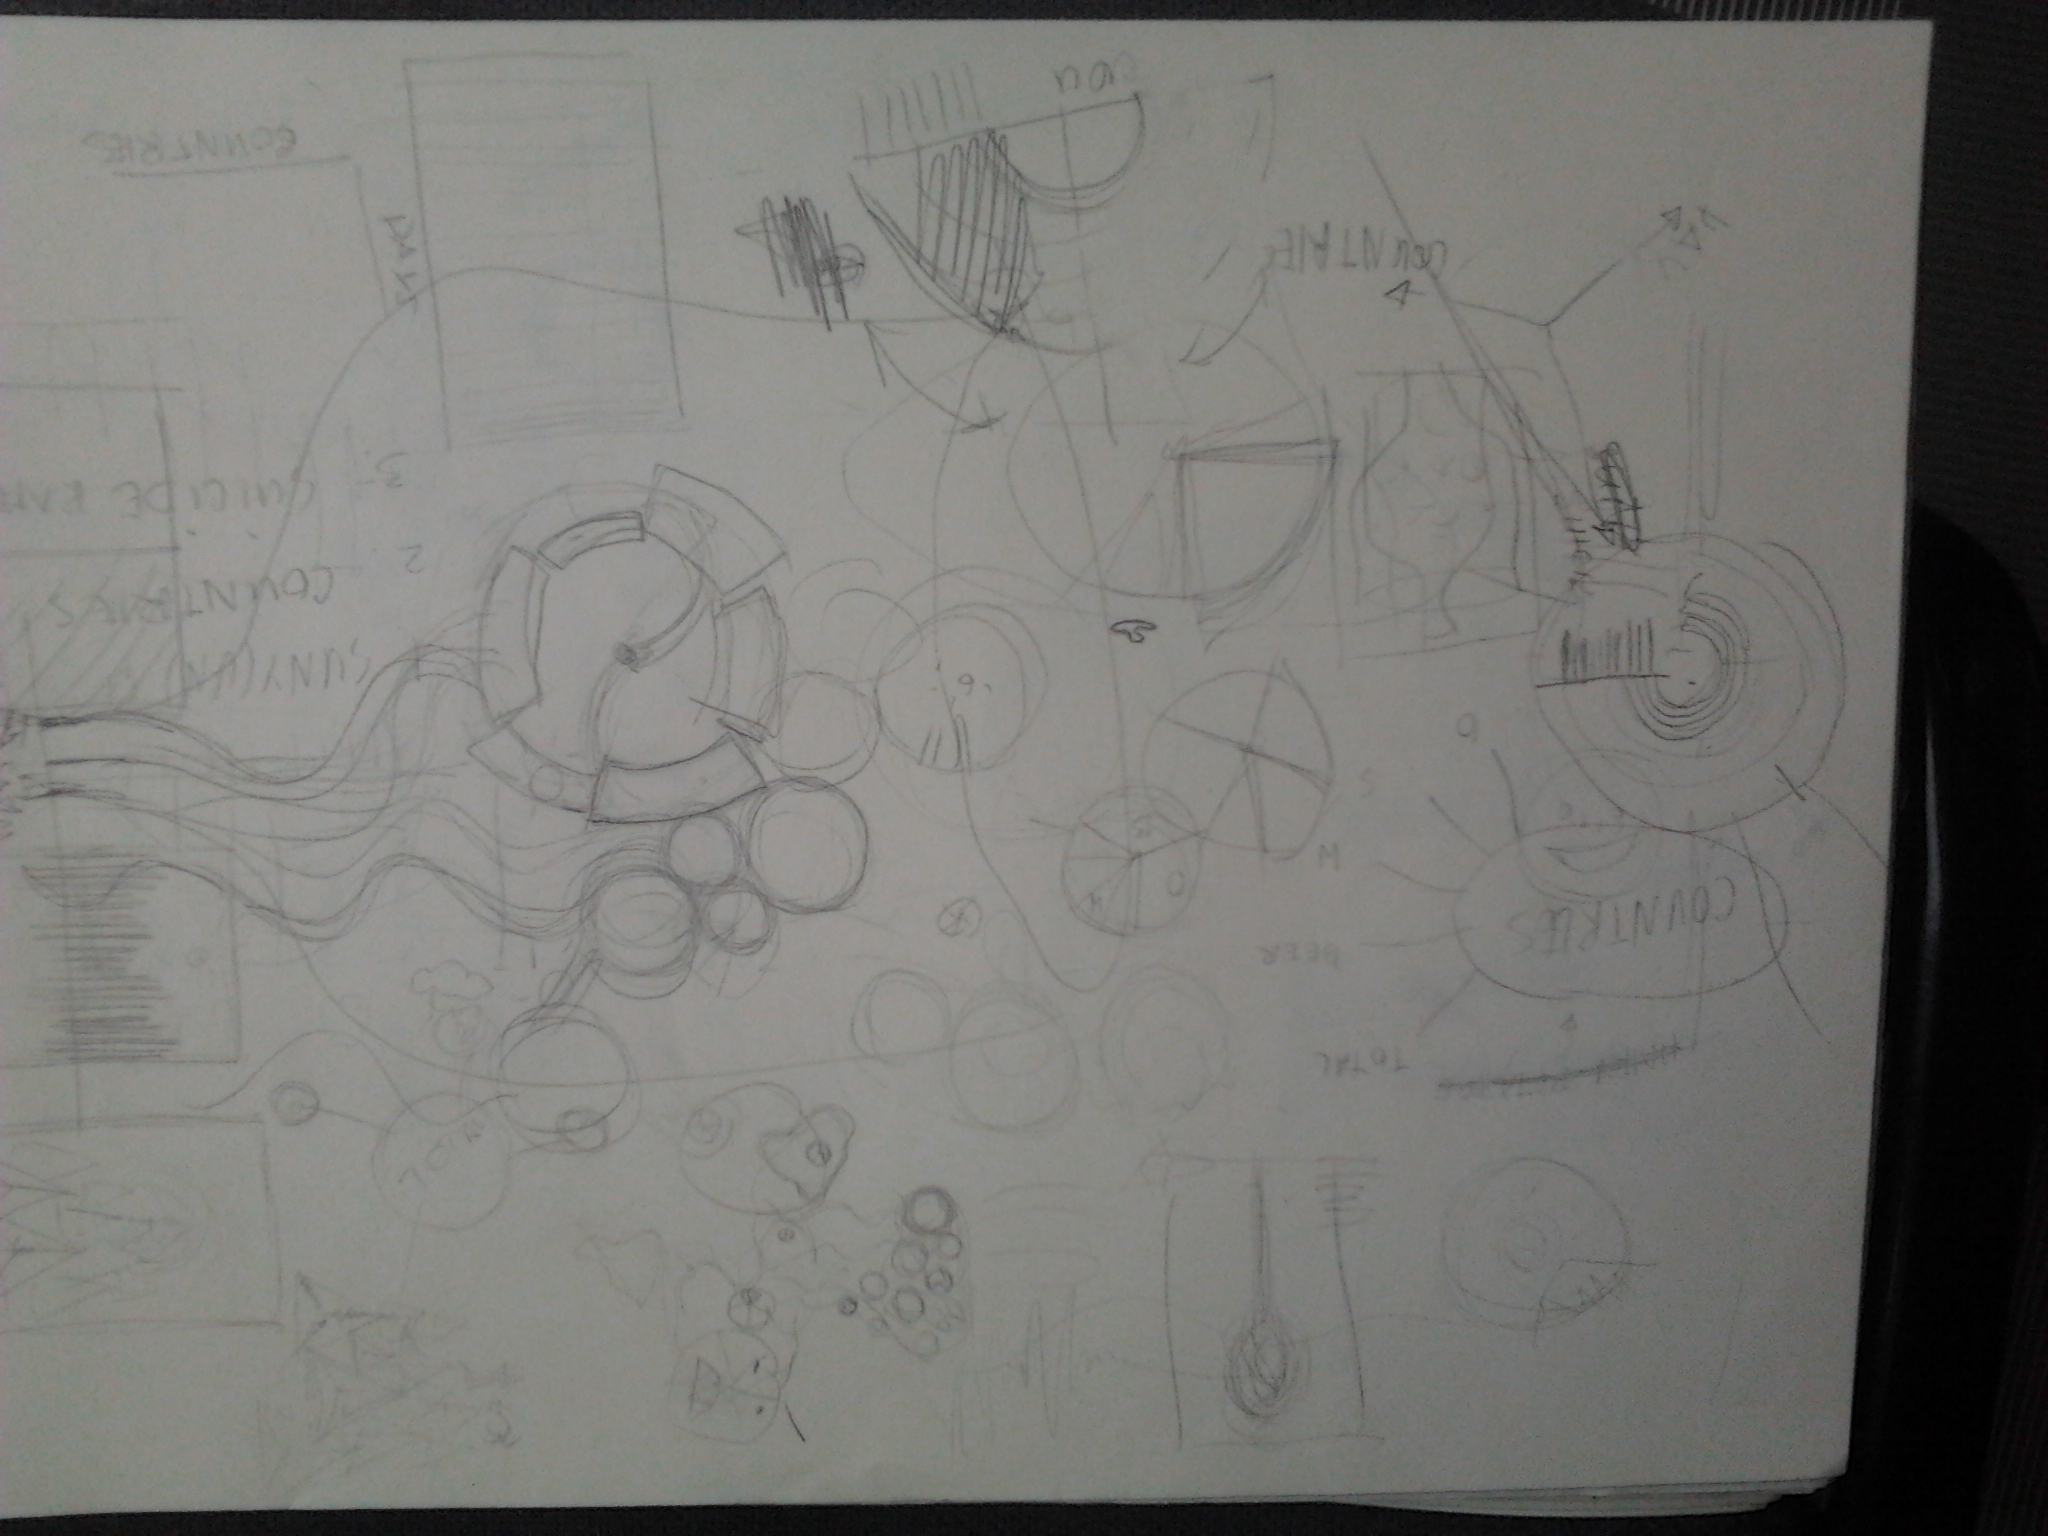
here are the first sketches of statistical graphics.
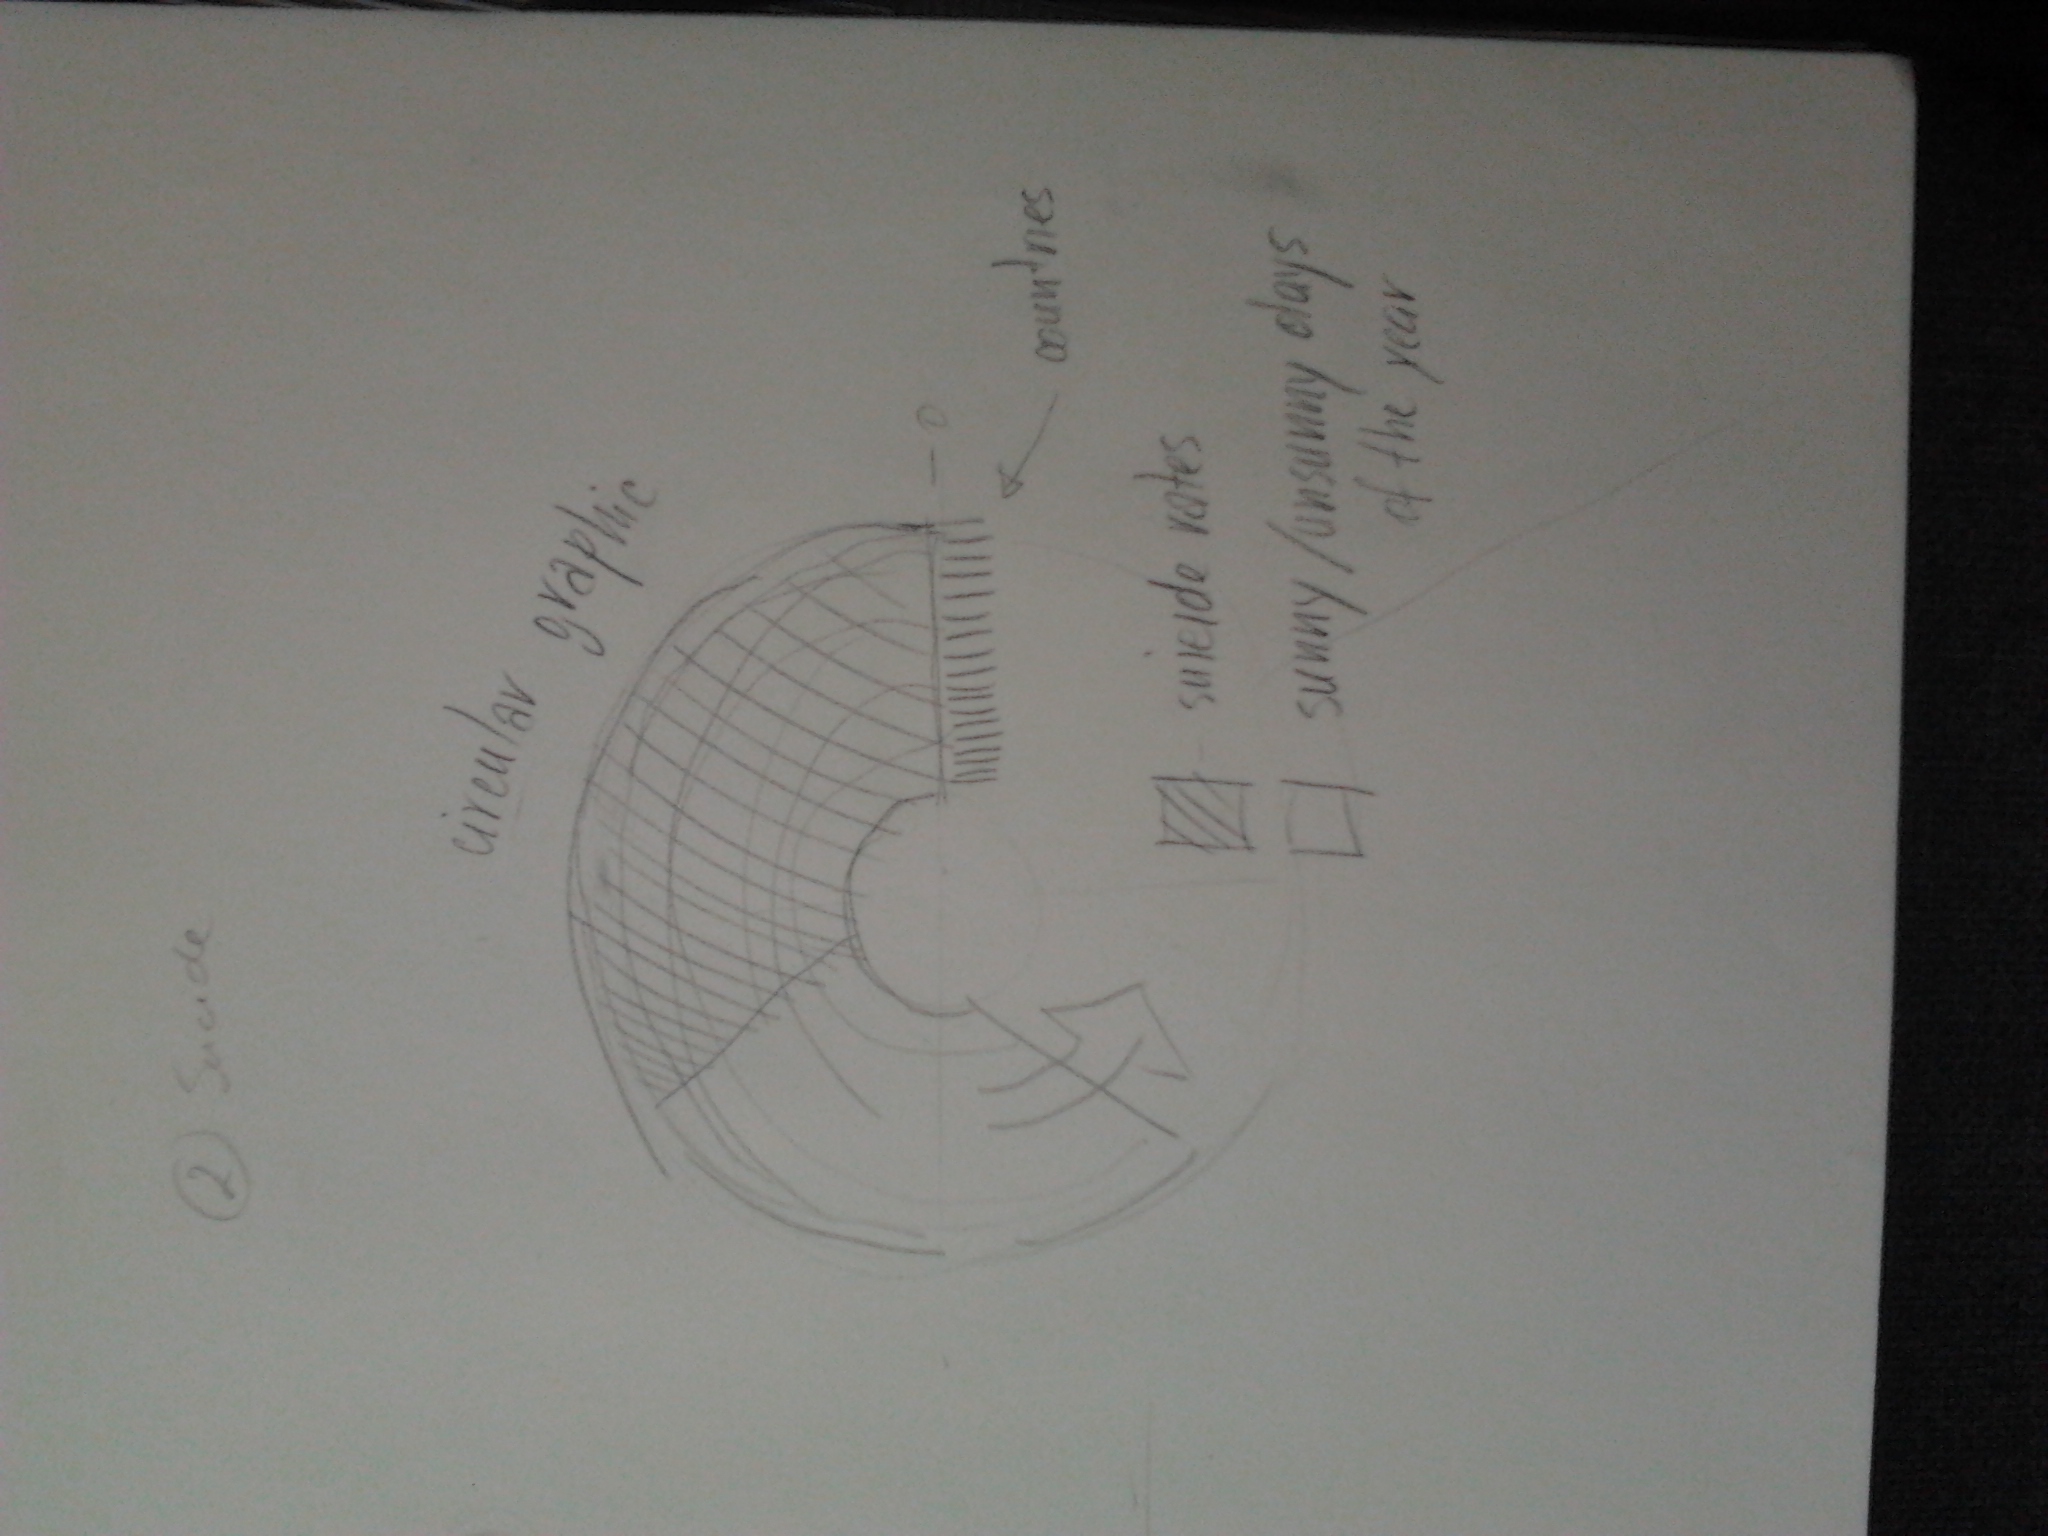
1 Suicide ratio to (un)sunny days in different countries. Circular graphic.
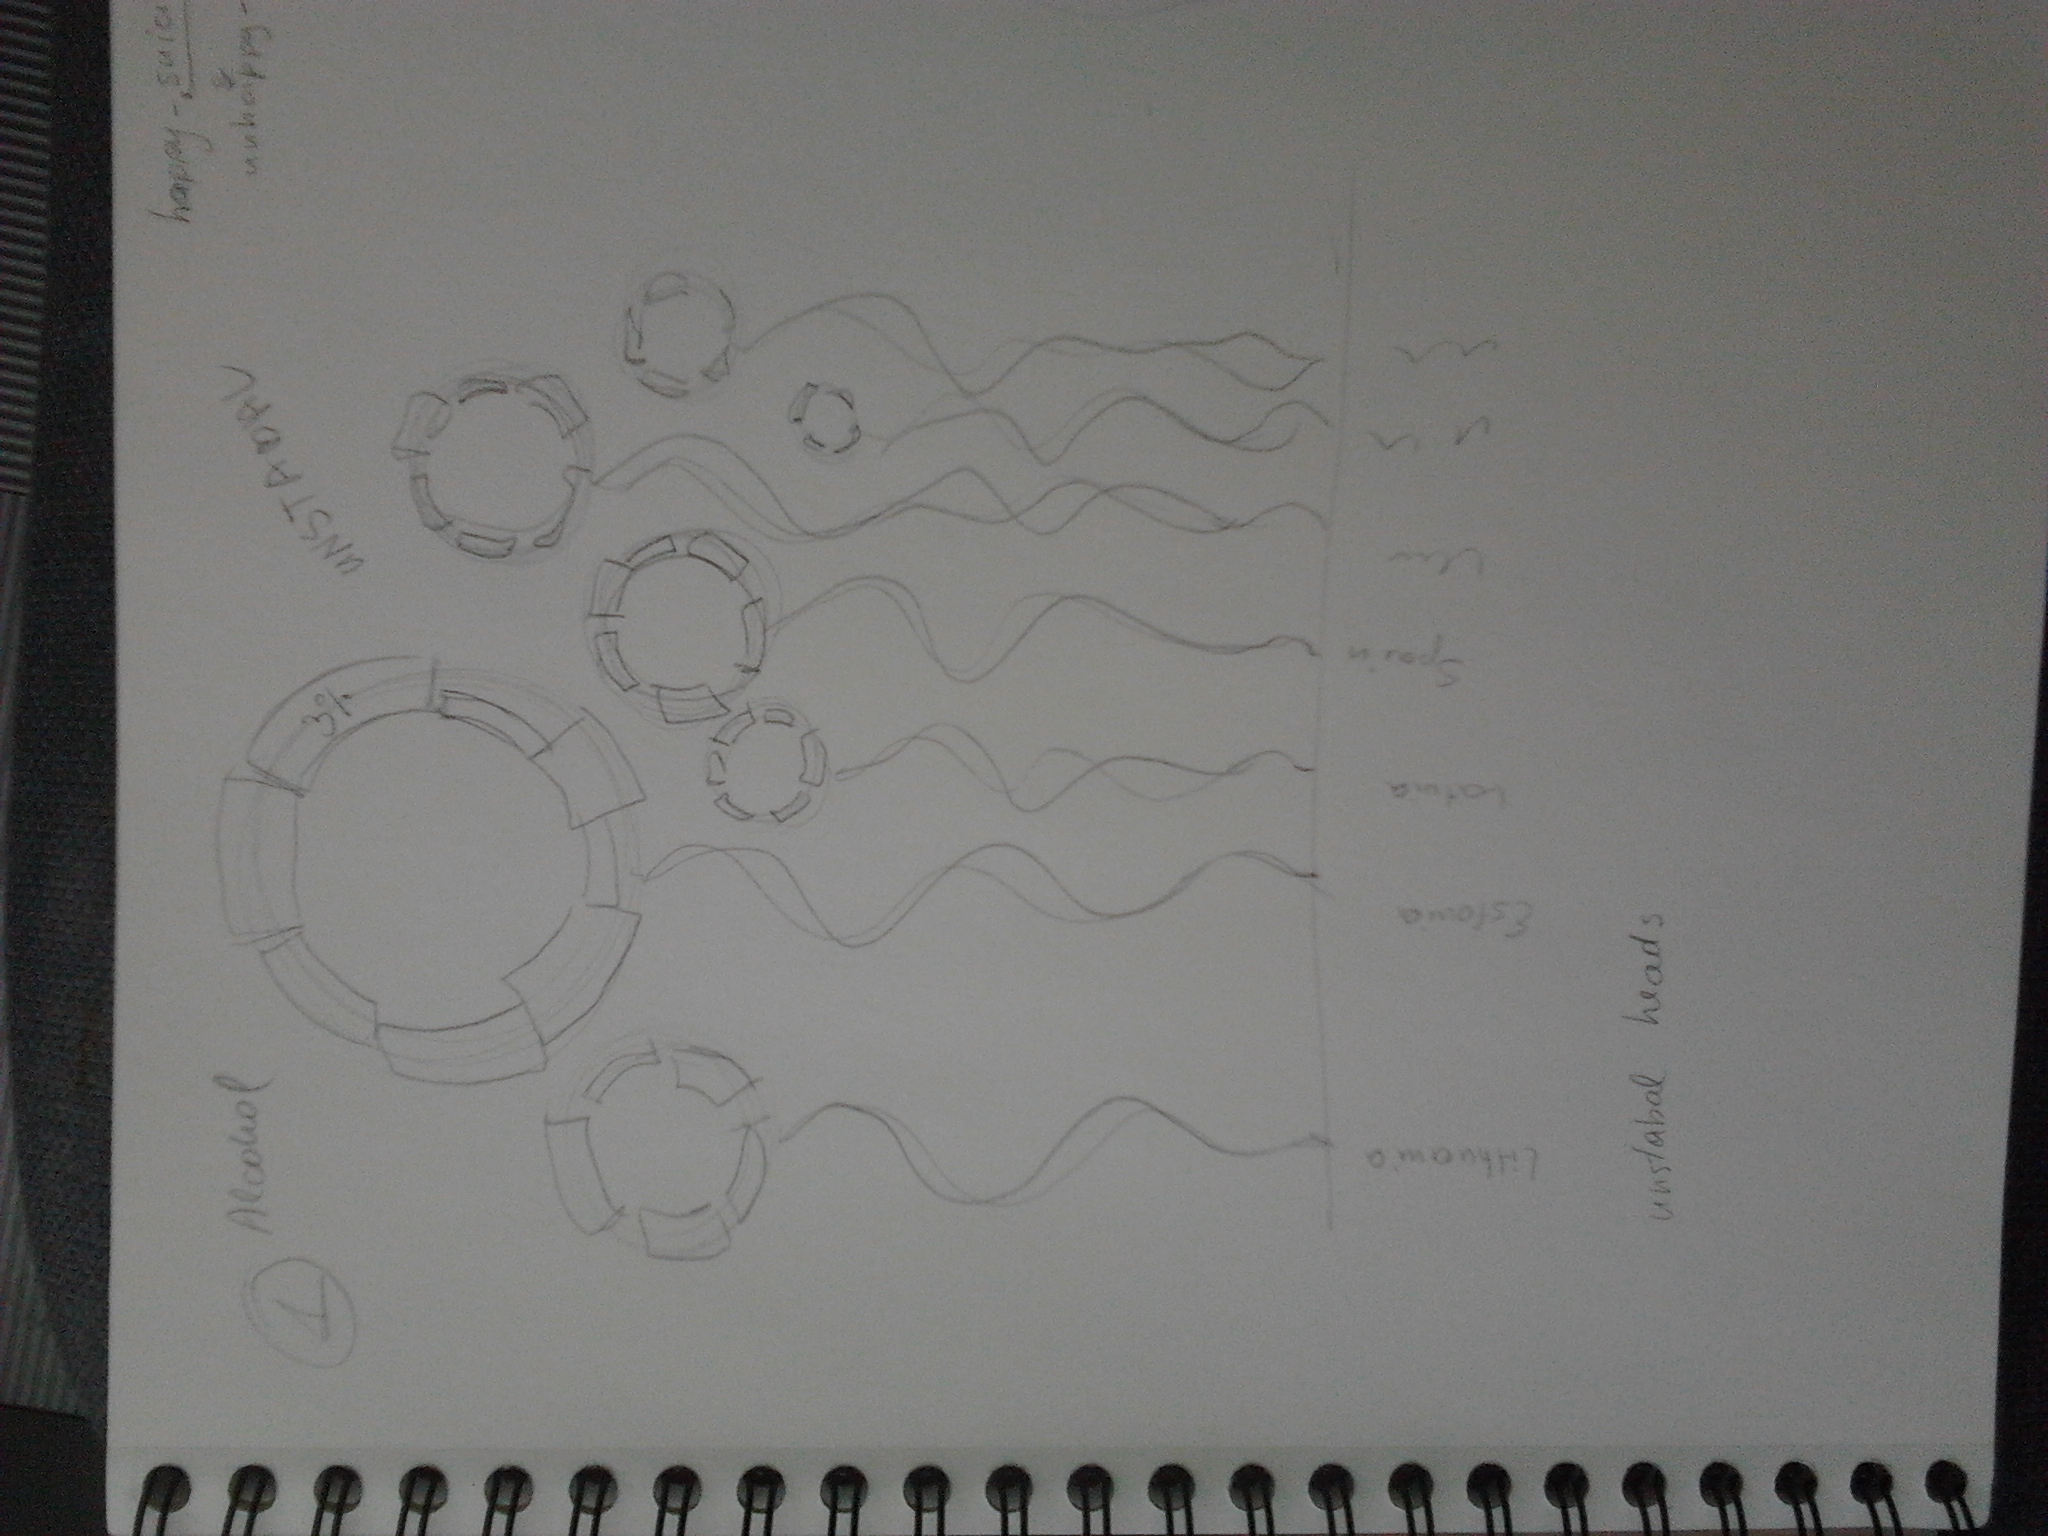
2 Alcohol (general and sorted by type, officially) consumption in different countries in Europe. Composition: Circular graphics with unstable, dynamic lines connected to list of countries. Reference to bubbles in alcohol :) or human heads.