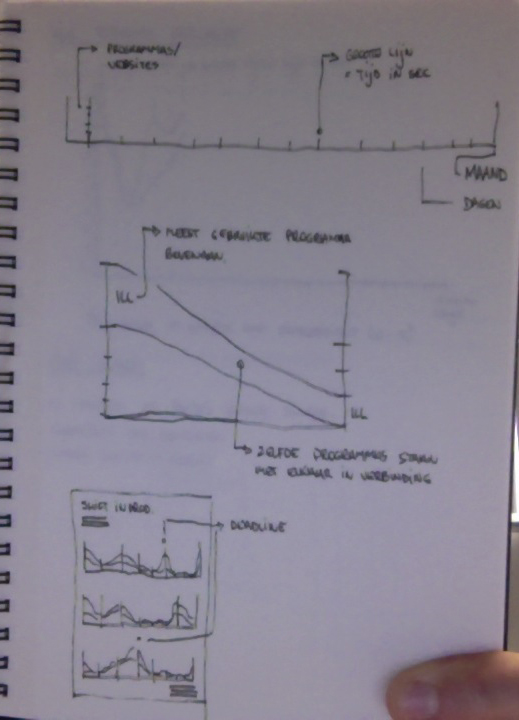
To realise the visualization, I had to make two different graphs on top of eachother.
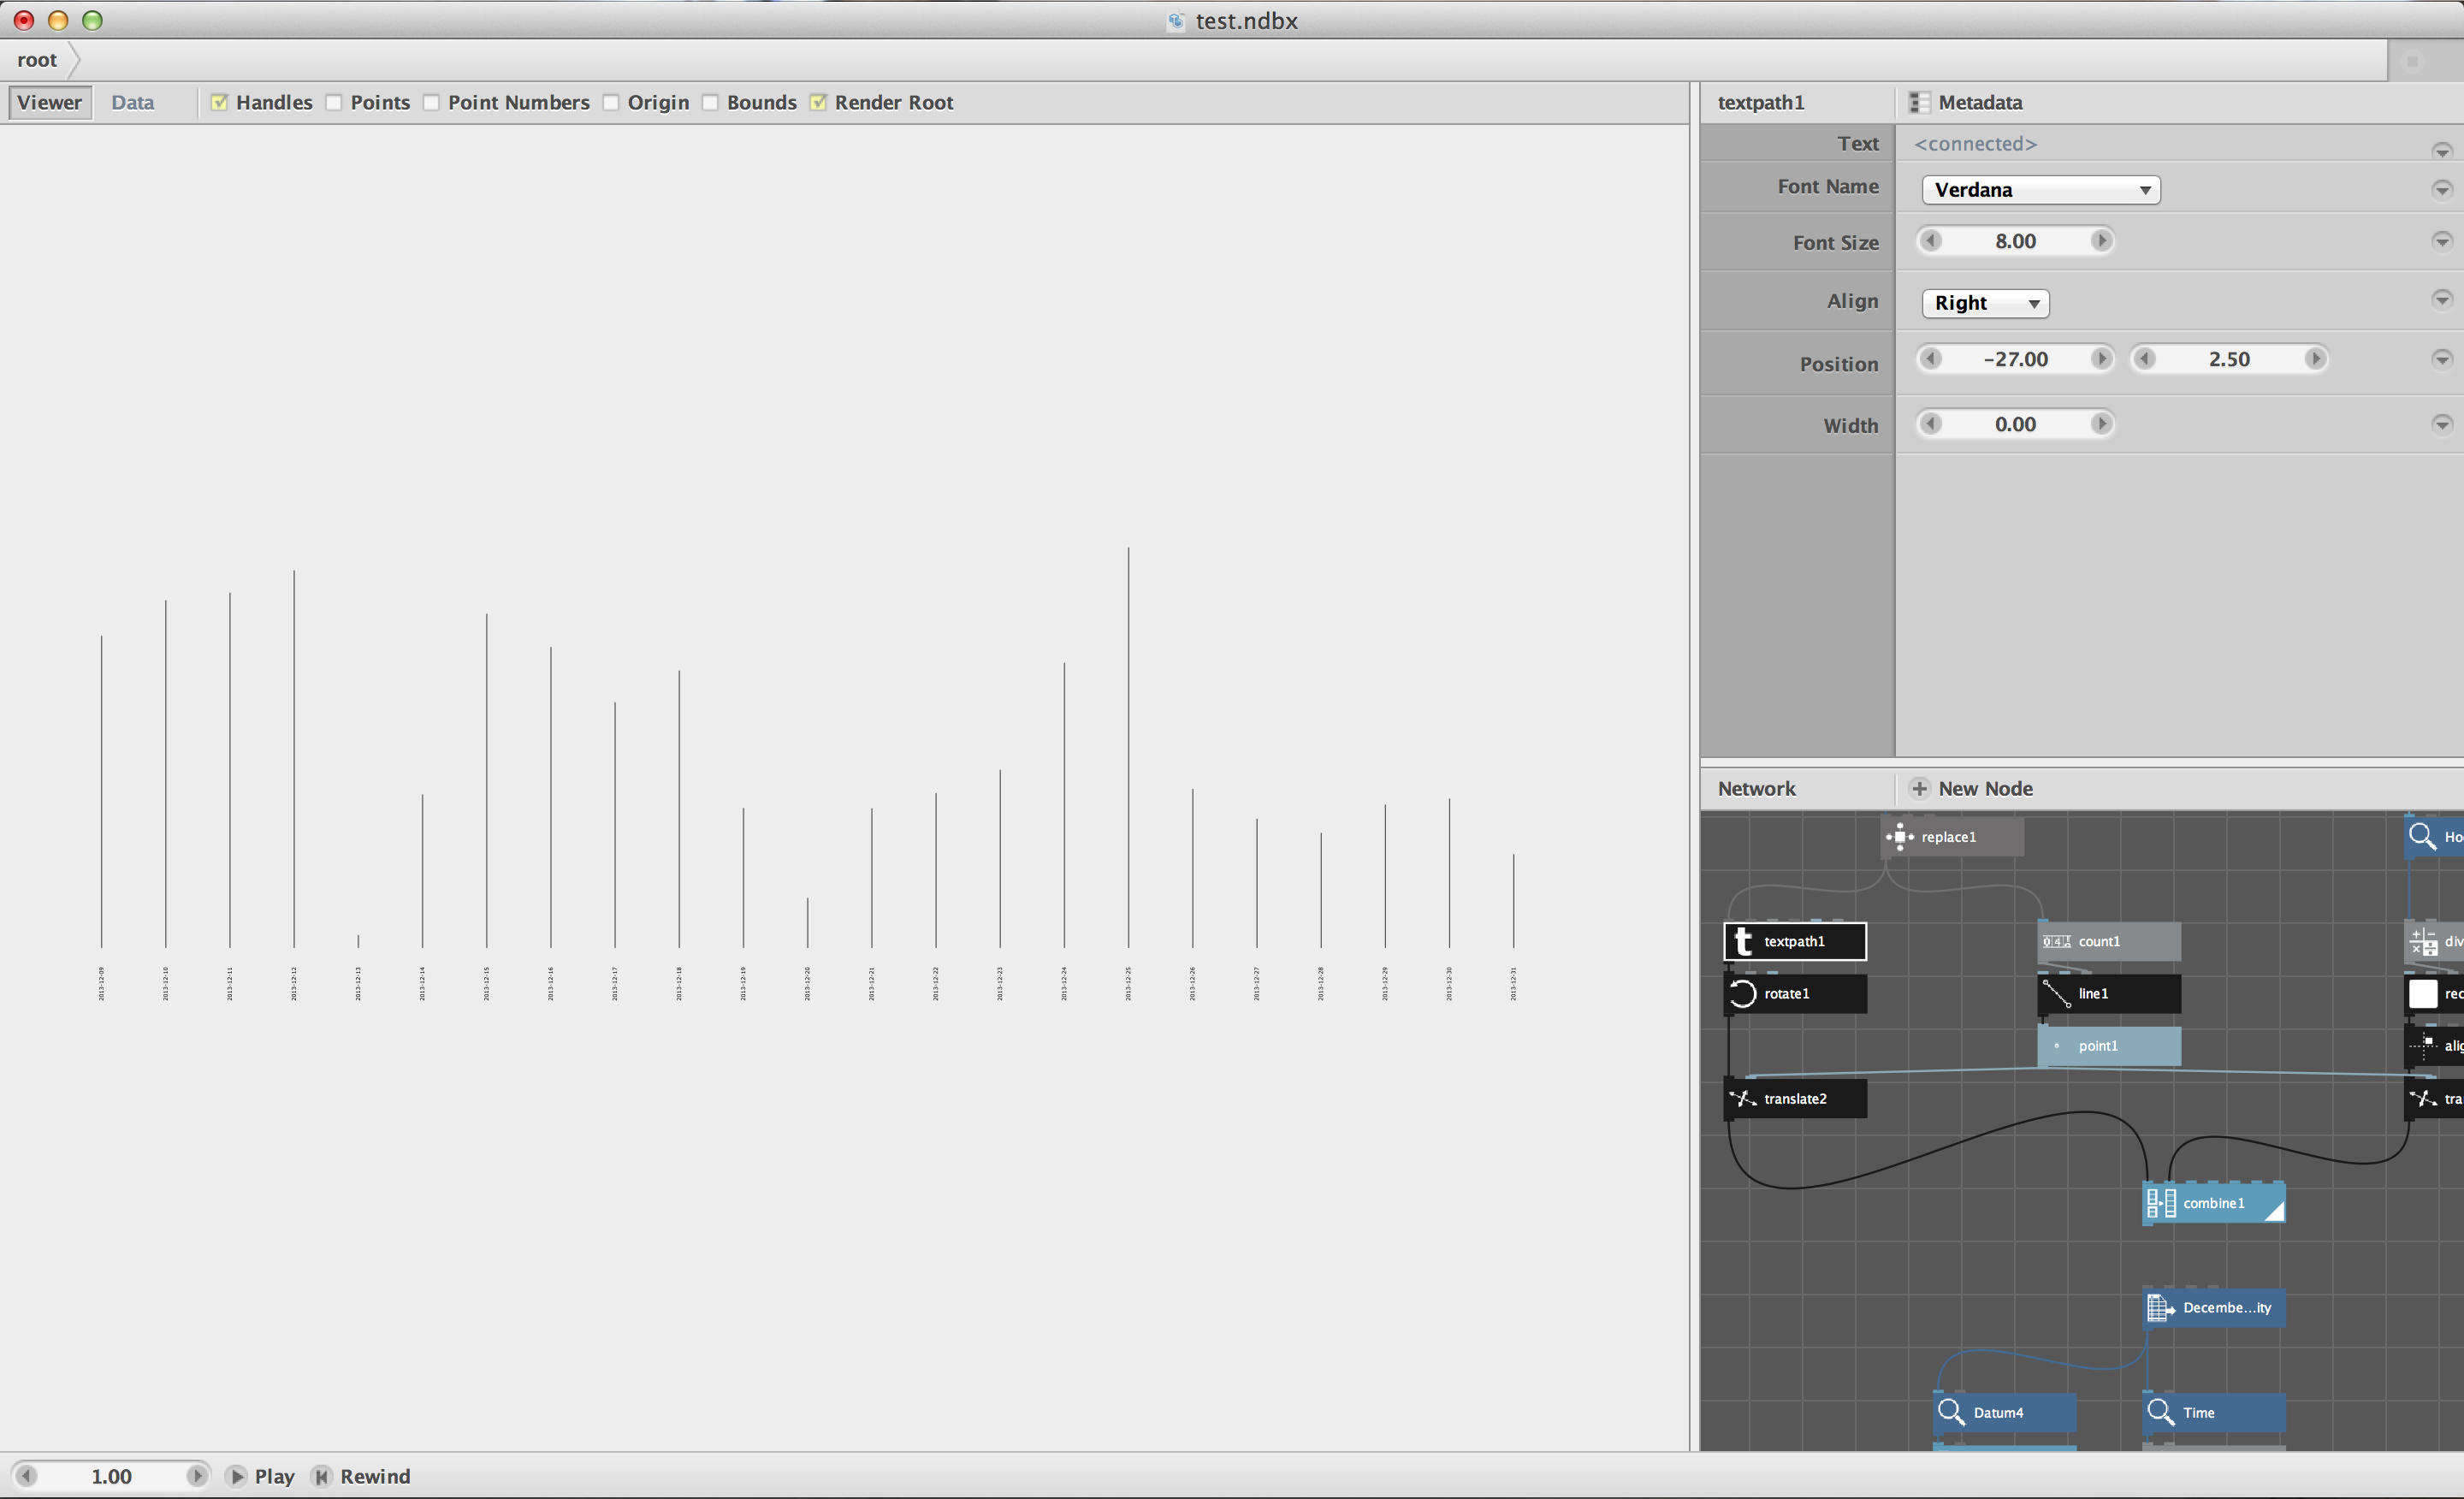
The first graph is a visualization of the time I spent (in seconds) per day in one month .
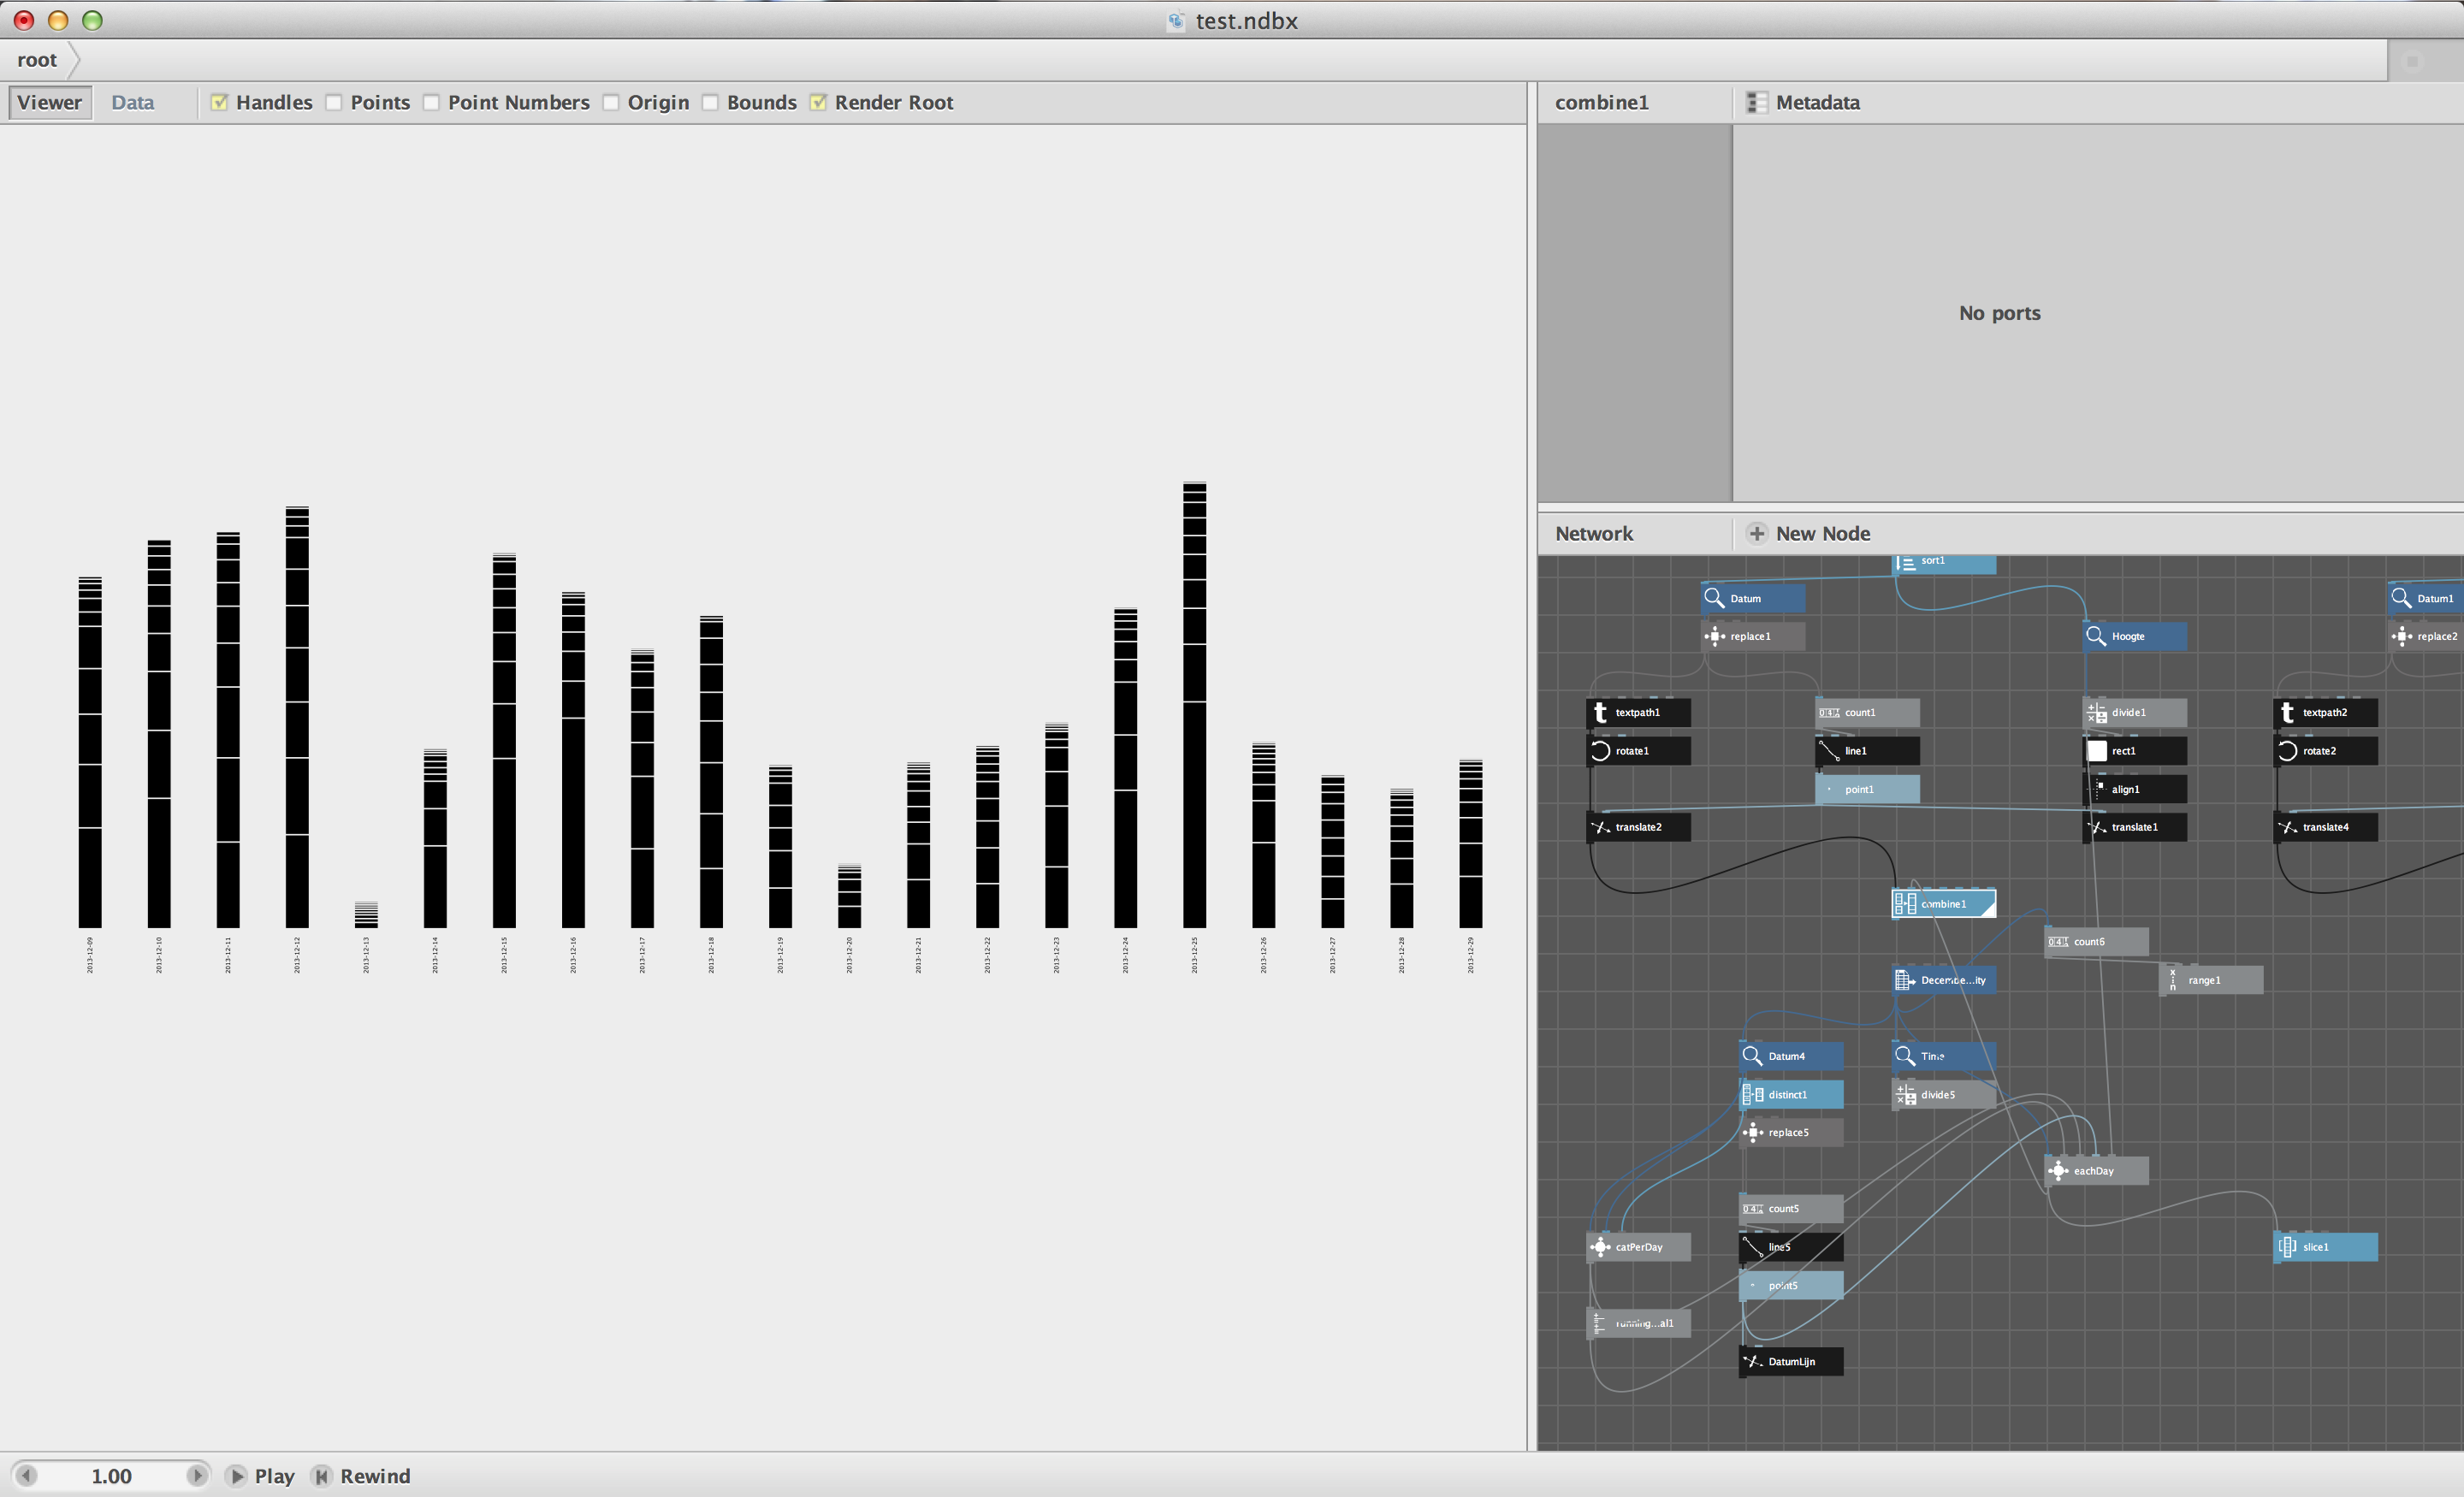
The second graph the time spent is divided by the categories (Design & Compositing, Social Networking, Entertainment, ...).
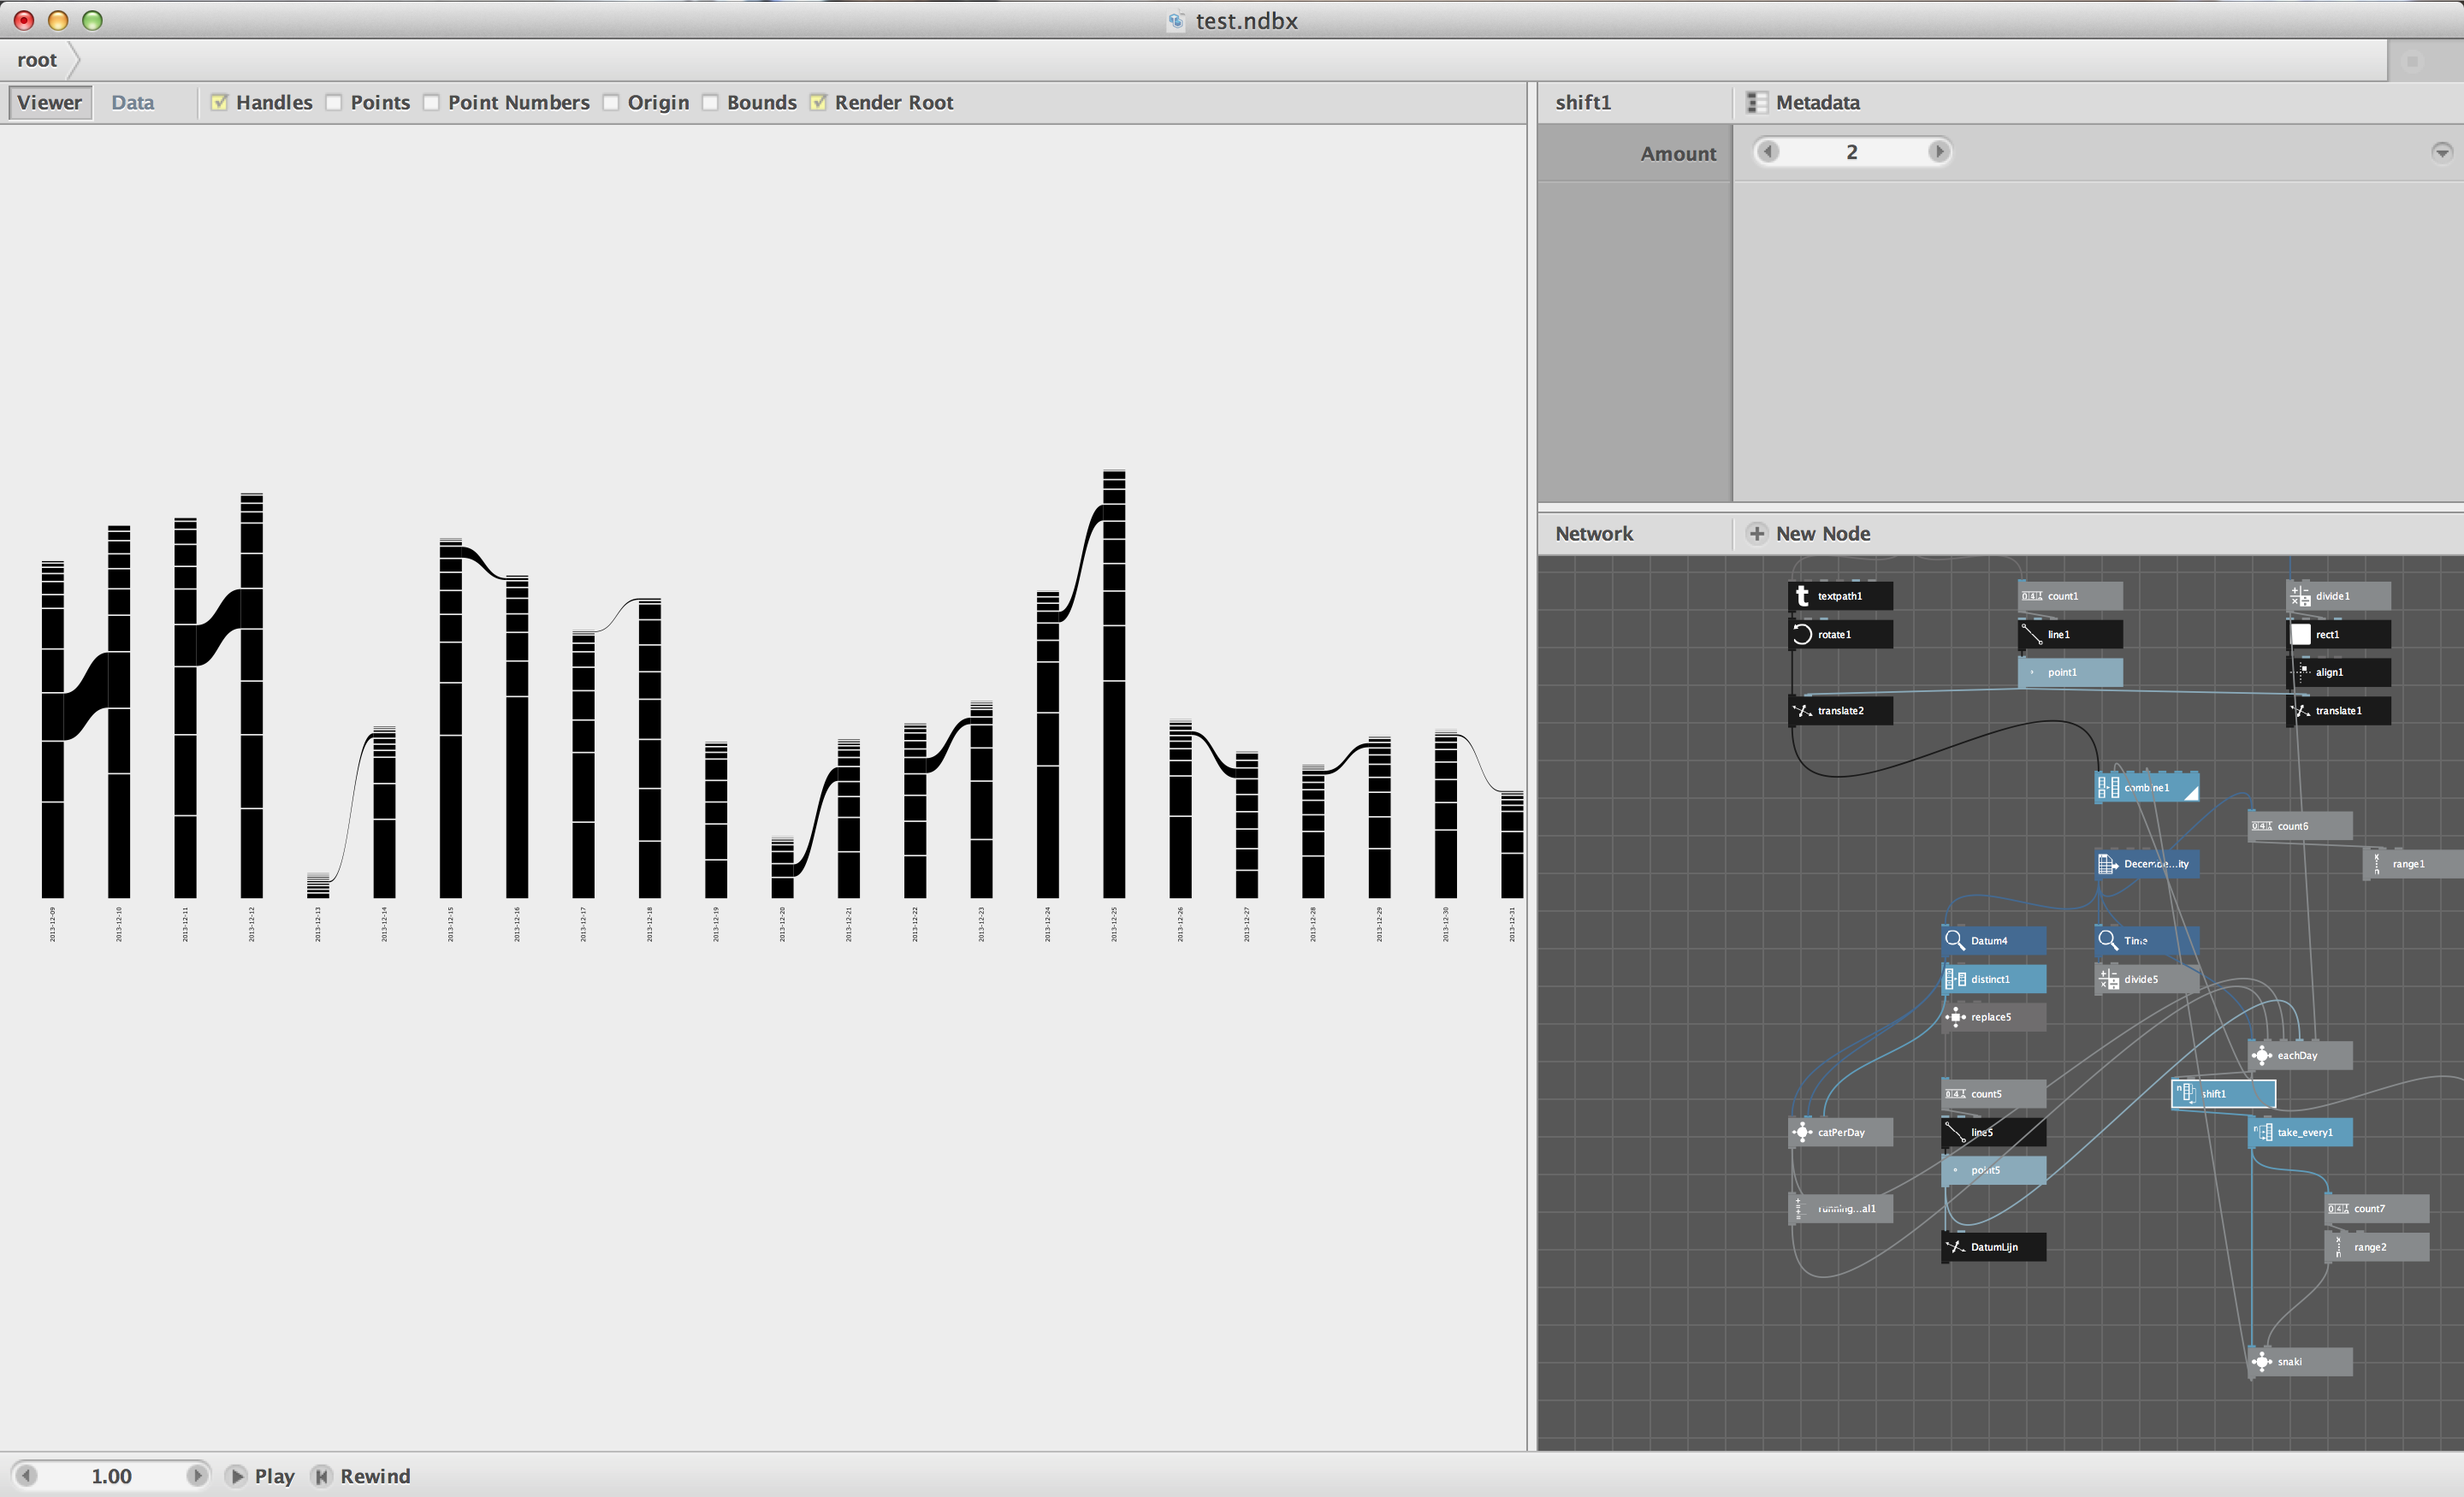
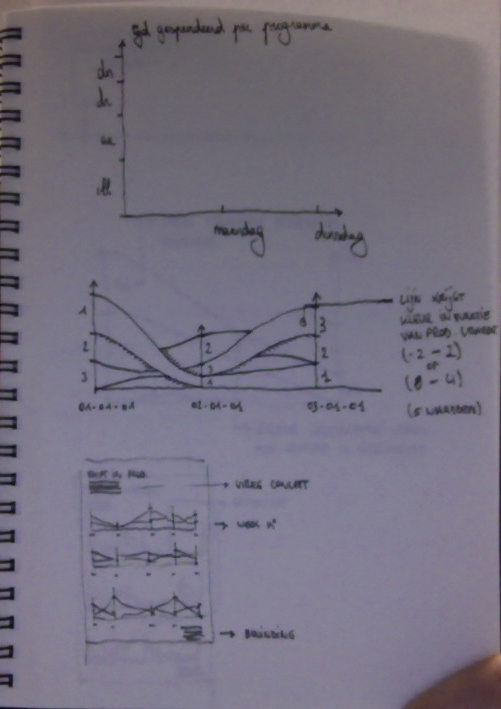
The final visualization would be a connection between the different categories per day, so a shift in productivity when approaching a deadline is visible, like the example in the third graph.